
Commentary
Despite a friendly report that showed US corn stocks on September 1st coming in at 1.361 billion bushels versus an average trade expectation of 1.439 billion, corn broke 11 cents today. Last year, September 1st stocks were 1.377 billion. On-farm stocks were 605 million bushels, well above last year’s number of 510 million. Off-farm stocks were 756 million bushels, well down from last year’s 867 million. It appears farmers may have decided to store more corn over the last few months. While the report was seen as friendly versus expectations it may have been pressure from wheat and soybeans which showed on farm surpluses versus expectations while suffering losses of over 20 cents, that may have contributed to weakness in corn. The lower figure for corn will do nothing in my view to nudge the USDA off of a 2.2 billion bushel carry in the next WASDE report.
Demand or lack thereof remains a problem in my opinion and will be even more highlighted as we get deeper into harvest. Chinese buyers reportedly purchased 10 to 12 cargoes of Ukrainian corn for November and December shipment. China is also slated to receive a heavy inflow of Brazilian corn during Fall, along with big domestic supplies, which could limit its appetite for U.S. corn and other grains. USDA announced daily corn sales to Mexico totaling nearly 1.9 million metric tons (MMT) last week — 1.273 MMT for 2023-24 and 611,389 metric tons (MT) for 2024-25. As of Sept. 21, outstanding new-crop corn sales to all destinations totaled 10.510 million metric tons, down 7.8% from last year and 34.5% behind the five-year average. When we flip to a demand side driven market from supply side after the November report, how is the trade psychology going to switch from sell the rallies to a buy the dips mentality? With wheat and beans on the defensive amid a higher dollar and economic uncertainty, the path of least resistance is lower in my view.
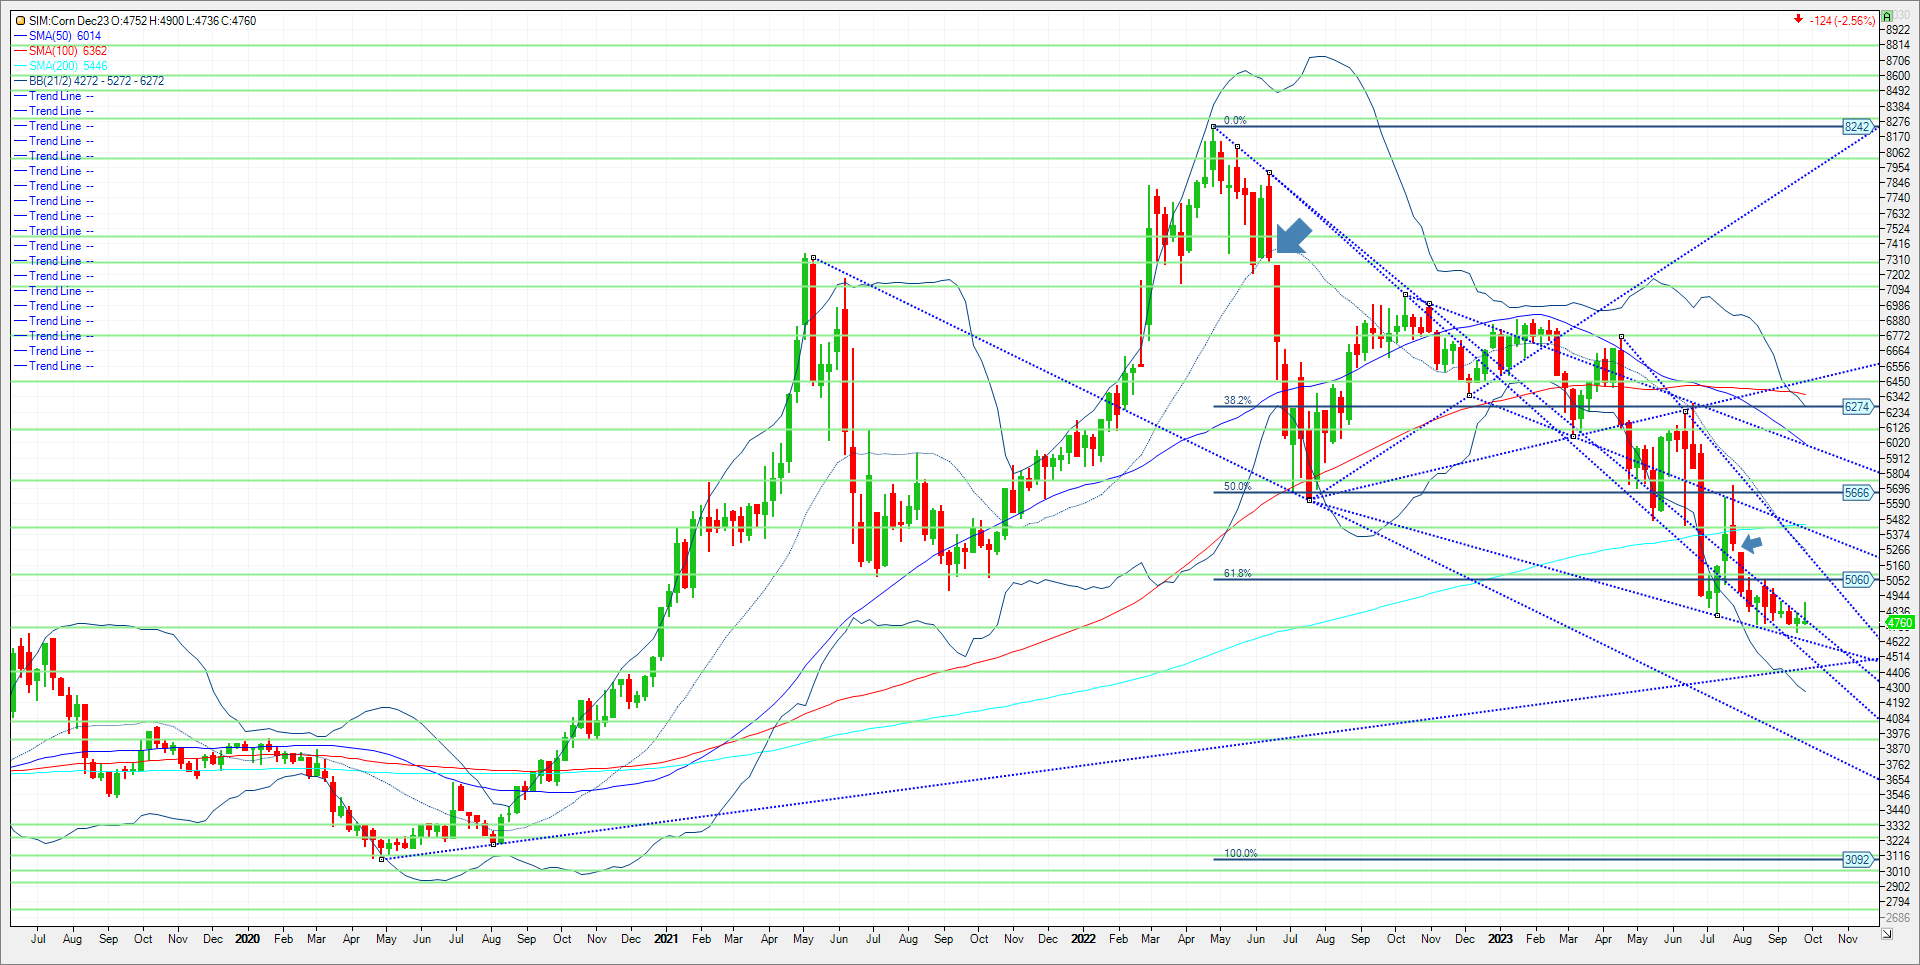
Technical levels for next week come in as follows. Support is first at 4.73/74. A close under and its 4.61. A close under 4.61 sends the market to 4.49 and then 4.44. Resistance is this week’s high at 4.90. A close above and its 5.06/5.07. A close above 5.07, look for the market to challenge 5.18 and then the gap at 5.25.
Please join me for a free grain webinar every Thursday at 3pm Central. We discuss supply, demand, weather, and the charts. Sign Up Now
Trade Ideas
Futures-N/A
Options-N/A
Risk/Reward
Futures-N/A
Options-N/A
Walsh Trading, Inc. is registered as a Guaranteed Introducing Broker with the Commodity Futures Trading Commission and an NFA Member.
Futures and options trading involves substantial risk and is not suitable for all investors. Therefore, individuals should carefully consider their financial condition in deciding whether to trade. Option traders should be aware that the exercise of a long option will result in a futures position. The valuation of futures and options may fluctuate, and as a result, clients may lose more than their original investment. The information contained on this site is the opinion of the writer or was obtained from sources cited within the commentary. The impact on market prices due to seasonal or market cycles and current news events may already be reflected in market prices. PAST PERFORMANCE IS NOT NECESSARILY INDICATIVE OF FUTURE RESULTS.
All information, communications, publications, and reports, including this specific material, used and distributed by Walsh Trading, Inc. (“WTI”) shall not be construed as a solicitation for entering into a derivatives transaction. WTI does not distribute research reports, employ research analysts, or maintain a research department as defined in CFTC Regulation 1.71.
Sean Lusk
Vice President Commercial Hedging Division
Walsh Trading
312 957 8103
888 391 7894 toll free
312 256 0109 fax
Walsh Trading
53 W Jackson Suite 750
Chicago, Il 60604