
Commentary
From a demand standpoint, the balance sheet remains supportive for soybeans in my opinion. With crops not in the ground in the Northern Hemisphere, Corn and Bean prices are largely driven by demand and weather down in South America during their main growing seasons in my opinion. Export inspections released by the USDA this morning showed inspections of 67.2 million bushels of soybeans in the week ending February 2nd . It was the fourth straight week that soybean shipments exceeded 65 million bushels as a delayed harvest in Brazil slows the availability of its cheaper supplies. China took in the majority in the amount of 42.6 million bushels. Marketing year soybean export shipments to date now exceed the seasonal pace needed to hit USDA’s target by 40 million bushels. Brazil’s soybean harvest advanced just four percentage points to 9% complete as of last Thursday, according to crop scouts. That was seven points behind the same time last year. Safrinha corn planting advanced to 12%, up seven percentage points on the week, though just half of last year’s pace for the date. It is assumed China will take shipment from U.S. ports just long enough until cheaper Brazilian supplies will arrive to fill their needs. That window may start closing soon, as long as the weather allows for loading of those Brazilian supplies.
Forecasts call for net drying across Argentina this week as spotty rains won’t be enough to offset evaporation rates amid hot temps. Crop scouts down in South America this weekend made the comparison of the current Argentine soybean crop to 2009, when yields finished a full 25% below trend, compared to the USDA’s current estimate for a result just 10% below trend. Crop-weighted rainfall results thus far have been similar or even slightly drier so far than 2009, while temperatures have exceeded that year at record levels this summer. Should the weather continue to worsen in Argentina, look for funds to possibly keep buying dips and squeeze this market higher in my view. With this in mind, consider the following trade using an option diagonal strategy.
Trade Idea
Futures-N/A
Options- Buy the April 1520 soybean call and sell the July 1620 call. Offer this spread at – 2 cents. ZSN23C1620:J23C1520[DG]
Risk/Reward
Futures-N/A
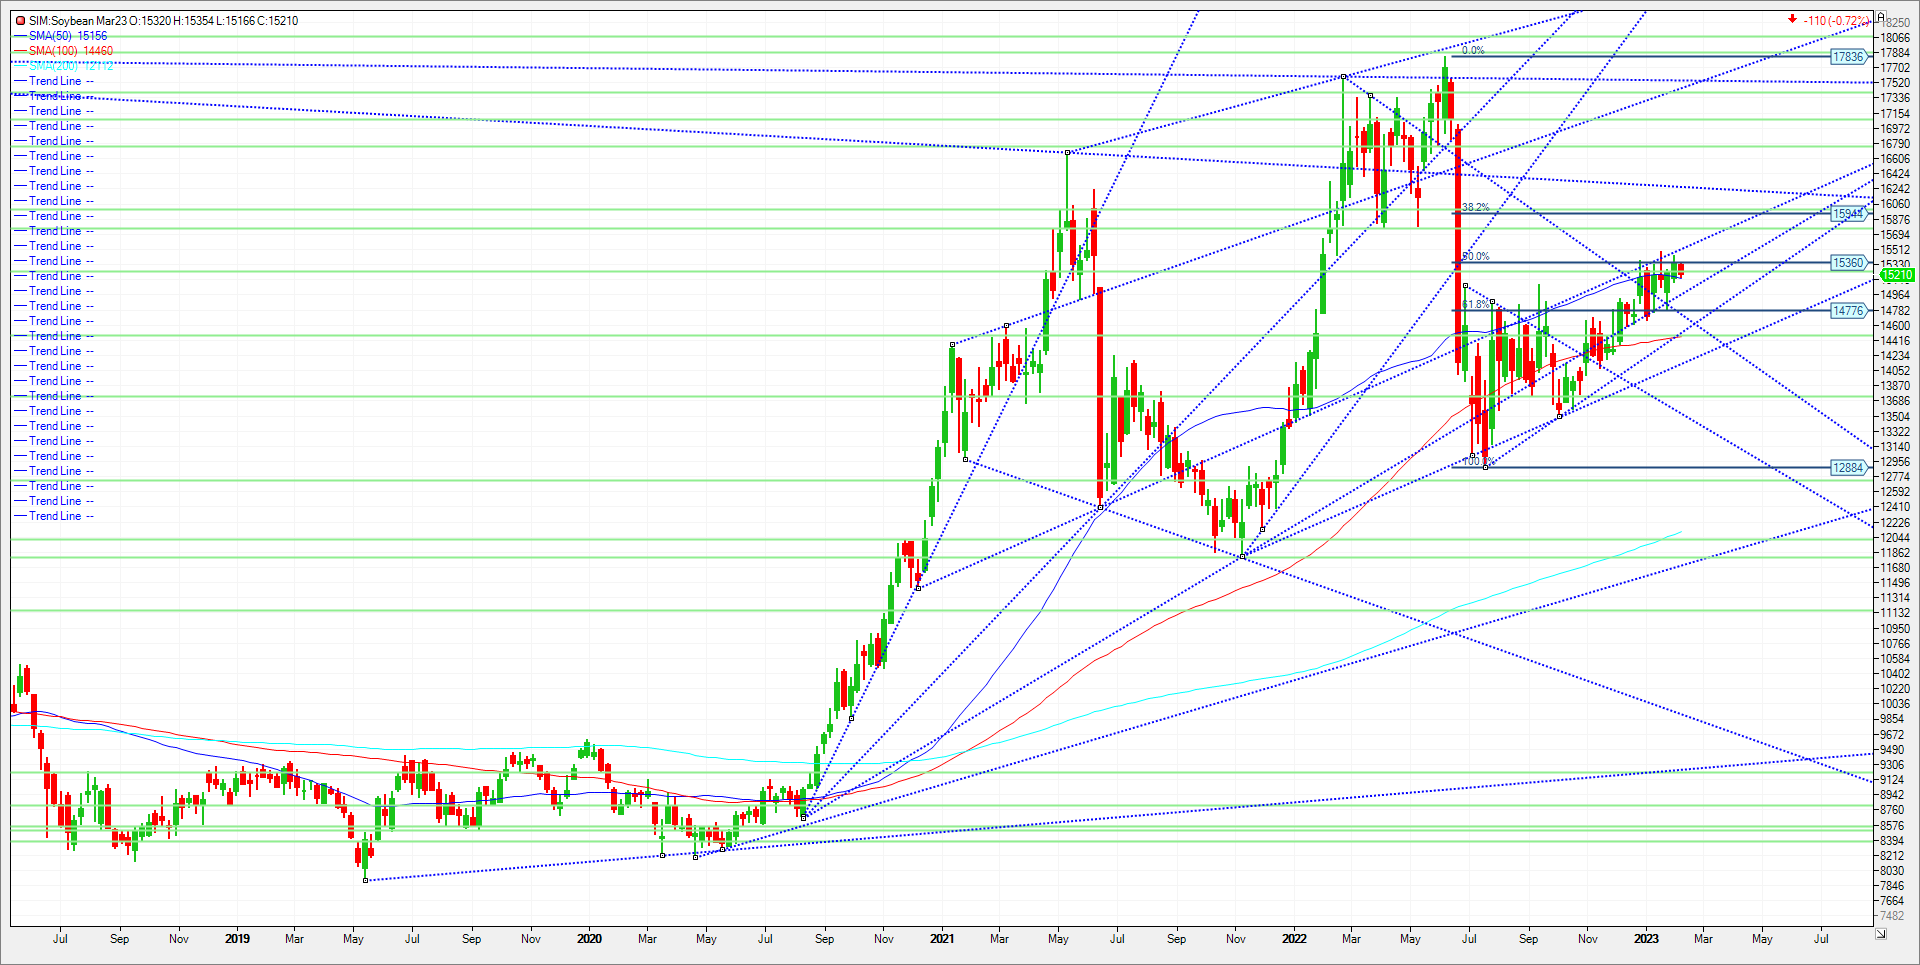
Options-The cost to entry if filled at – 2 cents on this spread is $100.00 plus trade costs and fees. However, this is not the risk as the risk in unlimited. That is because you are long one April soybean call just out of the money, while short a July 1620 call which doesn’t expire until late June and approximately 3 months after the long option rolls off the Board. Caution is warranted. Should the underlying May futures not rally in the next 3 weeks, I would suspect the long April option will lose premium faster than the deferred short call. This is a volatility play to the upside. A close under 1490 in the spot futures market and I would exit. We are looking for a rally near 1548 in May beans and possibly 1578 amid good demand and a worsening SA weather forecast. . A good rule of thumb with this strategy is that as one enters in as a spread, that one exits as a spread.
Please join me for a free grain and livestock webinar every Thursday at 3pm Central. We discuss supply, demand, weather, and the charts. Sign Up Now
Walsh Trading, Inc. is registered as a Guaranteed Introducing Broker with the Commodity Futures Trading Commission and an NFA Member.
Futures and options trading involves substantial risk and is not suitable for all investors. Therefore, individuals should carefully consider their financial condition in deciding whether to trade. Option traders should be aware that the exercise of a long option will result in a futures position. The valuation of futures and options may fluctuate, and as a result, clients may lose more than their original investment. The information contained on this site is the opinion of the writer or was obtained from sources cited within the commentary. The impact on market prices due to seasonal or market cycles and current news events may already be reflected in market prices. PAST PERFORMANCE IS NOT NECESSARILY INDICATIVE OF FUTURE RESULTS.
All information, communications, publications, and reports, including this specific material, used and distributed by Walsh Trading, Inc. (“WTI”) shall not be construed as a solicitation for entering into a derivatives transaction. WTI does not distribute research reports, employ research analysts, or maintain a research department as defined in CFTC Regulation 1.71.
Sean Lusk
Vice President Commercial Hedging Division
Walsh Trading
312 957 8103
888 391 7894 toll free
312 256 0109 fax
Walsh Trading
53 W Jackson Suite 750