
Commentary
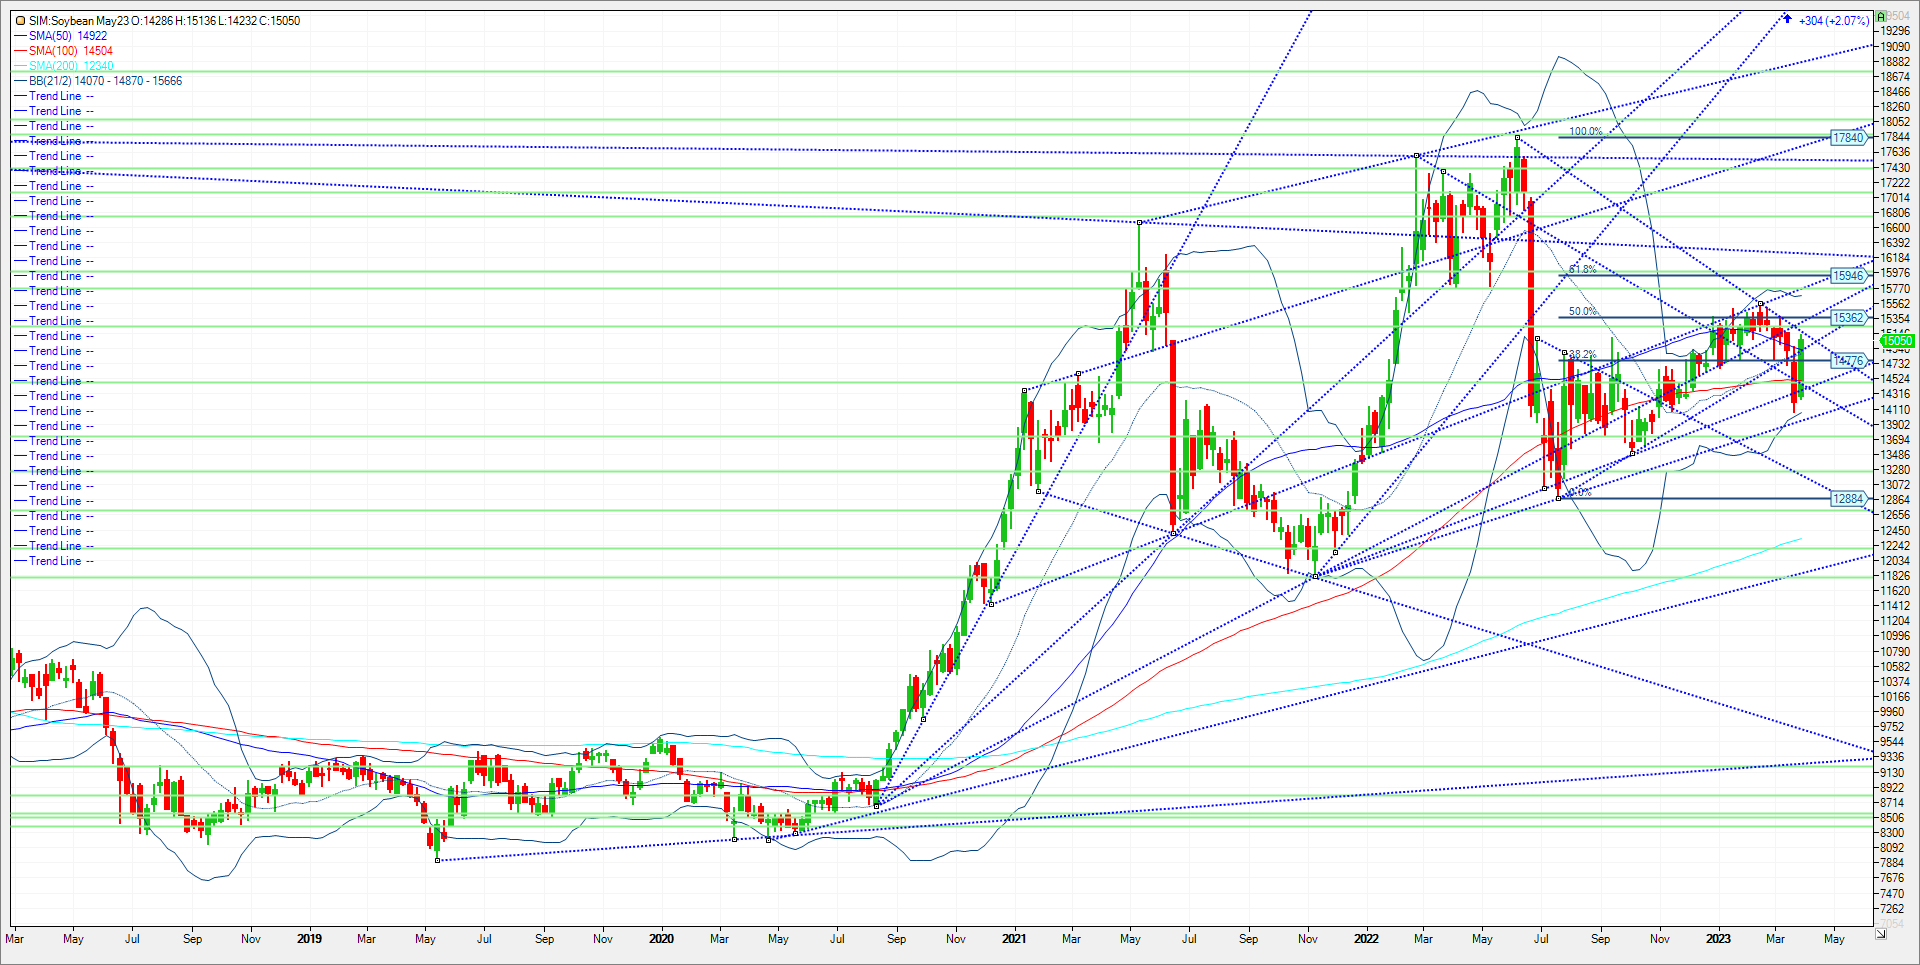
US soybean stocks on March 1 totaled 1.685 billion bushels versus an average expectation of 1.728 billion and a range of expectations from 1.600 to 1.910 billion. This suggests that USDA over-stated the size of last year’s crop in my opinion and will potentially need to lower US ending stocks in the next WASDE report on April 11th. US soybean plantings intentions for 2023 came in at 87.5 million acres versus an average expectation of 88.3 million (range 87.4-89.6 million. Total planted area for 2022 was 87.5 million acres. In the top 13 production states, planting intentions for soybeans are rather evenly split compared to year-ago, with five states down, four up and four unchanged from year-ago. Of note, soybean acres are expected to be unchanged from last year in the top two production states (Illinois and Iowa), along with the third leading producer (Nebraska). I believe the reduction in on farm stocks for beans could draw down domestic ending stocks from 210 million, down to 150 to 175 million in the next report. In my view any number under 200 is tight, while anything near 150 has funds talking price rationing. There’s an increased importance regarding demand, both inspections and sales for futures shipment given todays on farm stocks number. That said it may take the USDA multiple reports to whittle ending stocks further in subsequent reports and they can cite reduced crush as one reason amid many. In my view old crop beans have the potential to trade back up to yearly highs at 15.55, and possibly 5 percent higher on the year threshold at 16.00. They also have the possibility to head back to a key neckline support (See Chart), at 13.98. Trade the charts! Technical levels for next come in as follows for May 23 beans. Resistance is at 1512. A close over and its 15.35. Over 15.35 and the market could retest 1555. A close over that its 15.70 then 16.00, which represents a 5 percent higher for the year threshold. Support is at 1495 and 14.91. A close under and its back down to 1450 and then 1440. A close under 1440 and its Katy bar the door to the aforementioned neckline at 13.98.
Trade Ideas
Futures-N/A
Options-N/A
Risk Reward
Futures-N/A
Options-N/A
Please join me for a free grain and livestock webinar every Thursday at 3pm Central. We discuss supply, demand, weather, and the charts. Sign Up Now
Walsh Trading, Inc. is registered as a Guaranteed Introducing Broker with the Commodity Futures Trading Commission and an NFA Member.
Futures and options trading involves substantial risk and is not suitable for all investors. Therefore, individuals should carefully consider their financial condition in deciding whether to trade. Option traders should be aware that the exercise of a long option will result in a futures position. The valuation of futures and options may fluctuate, and as a result, clients may lose more than their original investment. The information contained on this site is the opinion of the writer or was obtained from sources cited within the commentary. The impact on market prices due to seasonal or market cycles and current news events may already be reflected in market prices. PAST PERFORMANCE IS NOT NECESSARILY INDICATIVE OF FUTURE RESULTS.
All information, communications, publications, and reports, including this specific material, used and distributed by Walsh Trading, Inc. (“WTI”) shall not be construed as a solicitation for entering into a derivatives transaction. WTI does not distribute research reports, employ research analysts, or maintain a research department as defined in CFTC Regulation 1.71.
Sean Lusk
Vice President Commercial Hedging Division
Walsh Trading
312 957 8103
888 391 7894 toll free
312 256 0109 fax
Walsh Trading
53 W Jackson Suite 750
Chicago, Il 60604