
Daily Live and Feeder Cattle charts have made a bearish turn. Potential double top in weekly charts?
The information and opinions expressed below are based on my analysis of price behavior and chart activity
Sign Up to receive Walsh Trading’s 1st Half of 2026 Market Outlook First Half of 2026 Outlook for the Livestock and Grain markets.
June Live Cattle (Daily)
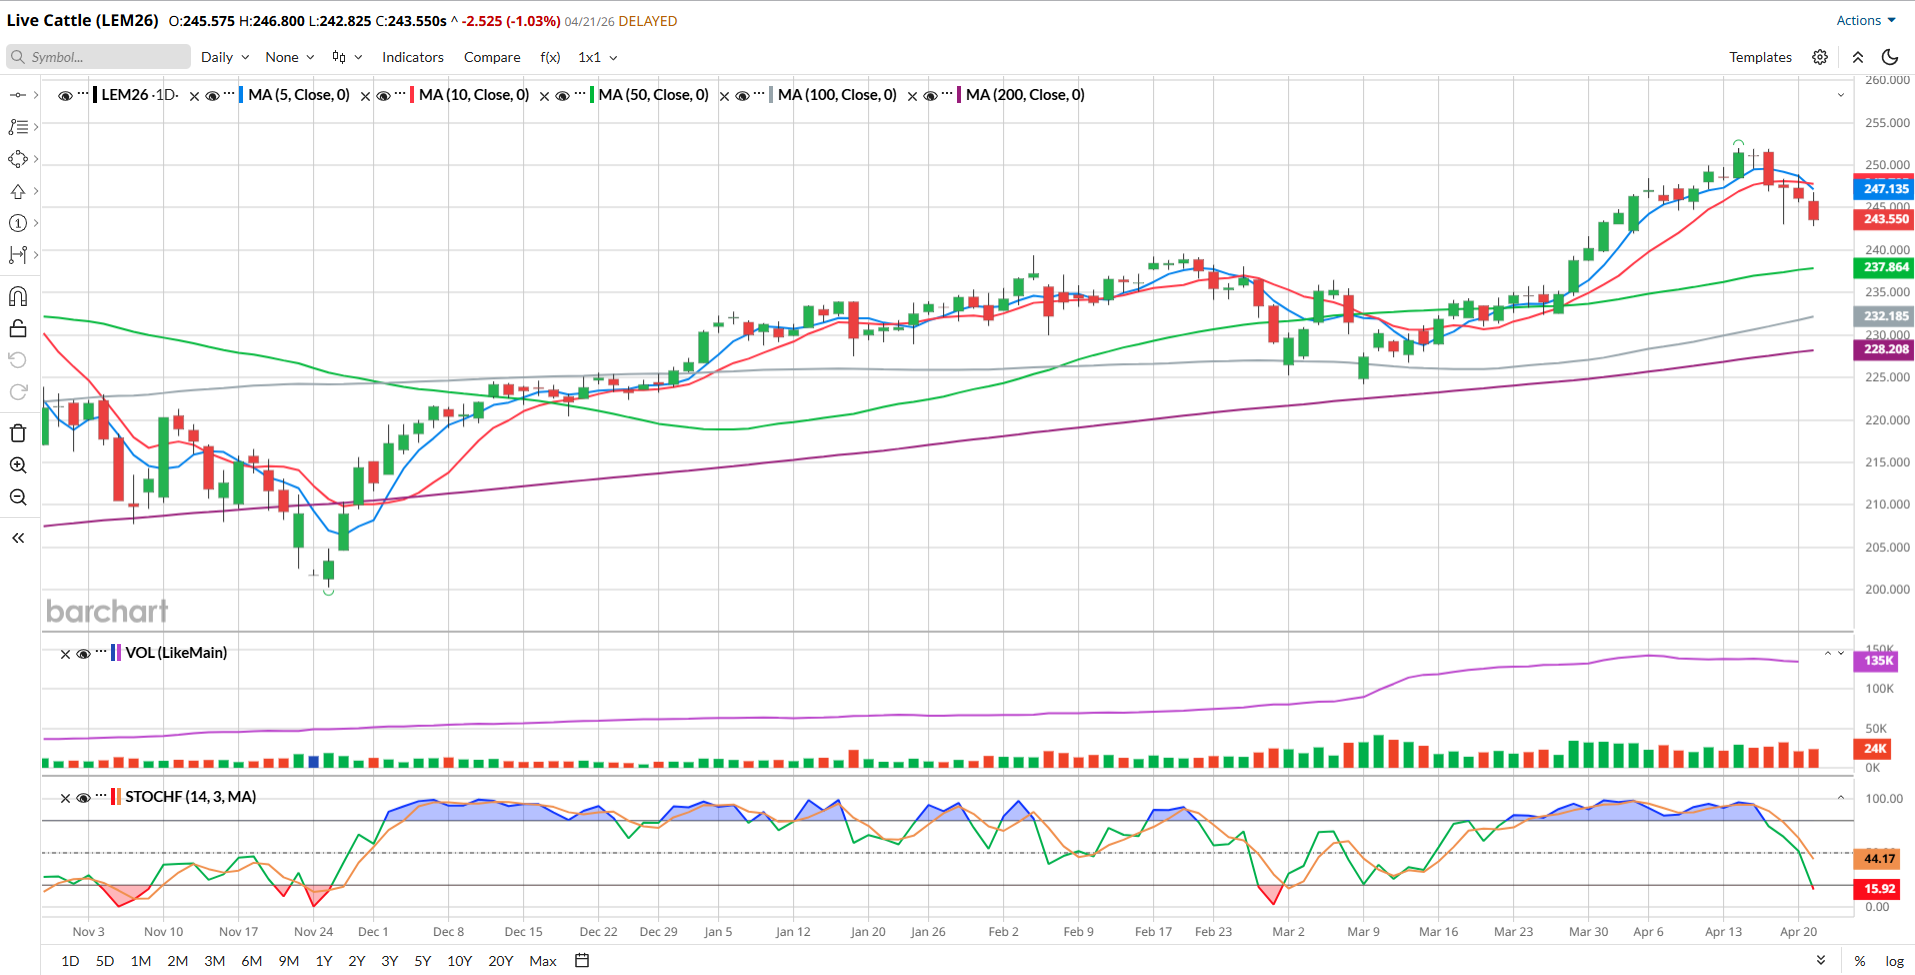
Today, June Live Cattle closed down 2.525 to settle at 243.55 and August Feeders (now the front month according to volume and open interest) dropped 2.40 to settle at 358.950.
The Cattle on Feed report that was released last Friday show the entire US inventory declined by 1% from last year to 11.6 million head. Placements dropped by 7% to 1.71 million head, the second lowest level since 1996, and Marketings slid by 6% to 1.63 million head. On the surface, those are all bullish numbers, clearly showing that the US herd numbers are still in decline. But so far this week, prices have been declining.
The first reason for the decline might be the short-term technical top that I wrote about in this space last week. The second reason might be that there are many speculative rumors as to when the border may (or may not) re-open to live imports from Mexico. And a third might be that there’s a general sense of skepticism among cattle producers about the strength of the recent rallies.
I made the case for the short-term technical top last week, so I won’t repeat myself.
As far as the rumor mill goes, many folks seem to have the opinion that the border re-opening will be announced sooner, rather than later. The Secretary of Ag is supposed to be in AZ later this week and the consensus appears to be that she’ll announce a timeline for a phased re-opening. Allegedly, there’ve been additional cases of screwworm creeping closer to the border, 60 miles or so last I heard, which might postpone that announcement.
And I know that most of the cattle producers that I’ve spoken with over the past month or so have been very concerned that prices would not be able to set new highs, which we did last week. There may be some producer-driven hedge pressure going on.
By looking at the chart above, you may notice a few things. Today, the 5- and 10-day moving averages (blue/red) made a bearish crossover in Live Cattle. August Feeders (not pictured) made that bearish crossover yesterday. On the chart above, those averages are offering potential resistance at 247.135 and 247.795, respectively. The 50-day (green), 100-day (grey) and 200-day (purple) are all still in a bullish configuration and inclined higher. The 50-day is the closest potential support level at 237.864. Stochastics (bottom sub-graph) are just starting to tick into oversold territory and are pointing lower.
Aggressive and well-margined traders may do well to consider short futures positions in Live and/or Feeder Cattle. An entry near Monday’s low might be suitable. That was 245.625 for the June Live Cattle and 360.800 for August Feeders. As I don’t know your risk tolerance or what may be appropriate for your account size, I’ll leave a protective buy-stop up to you. For a downside target, I might suggest the 100-day moving average, 232.200 or so for the Live or 349.750 for the Feeders. That would work out to a gain of $5,370 in the June Live Cattle and/or a gain of $5,525 in the August Feeders, per contract and before your commissions/fees.
Less aggressive traders or hedgers may do well to consider Put options. June Live Cattle Puts expire in 45 days and August Feeder Cattle Puts expire in 128 days. June Live Cattle 235 Puts settled at 2.75 or $1,100 out-of-pocket before your commissions/fees. August Feeder Cattle 250 Puts settled at 11.80 or $5,900 out-of-pocket before your commissions/fees. If those are too pricey for you, call me for some bearish spread ideas.
June Live Cattle and August Feeder Cattle (Weekly)
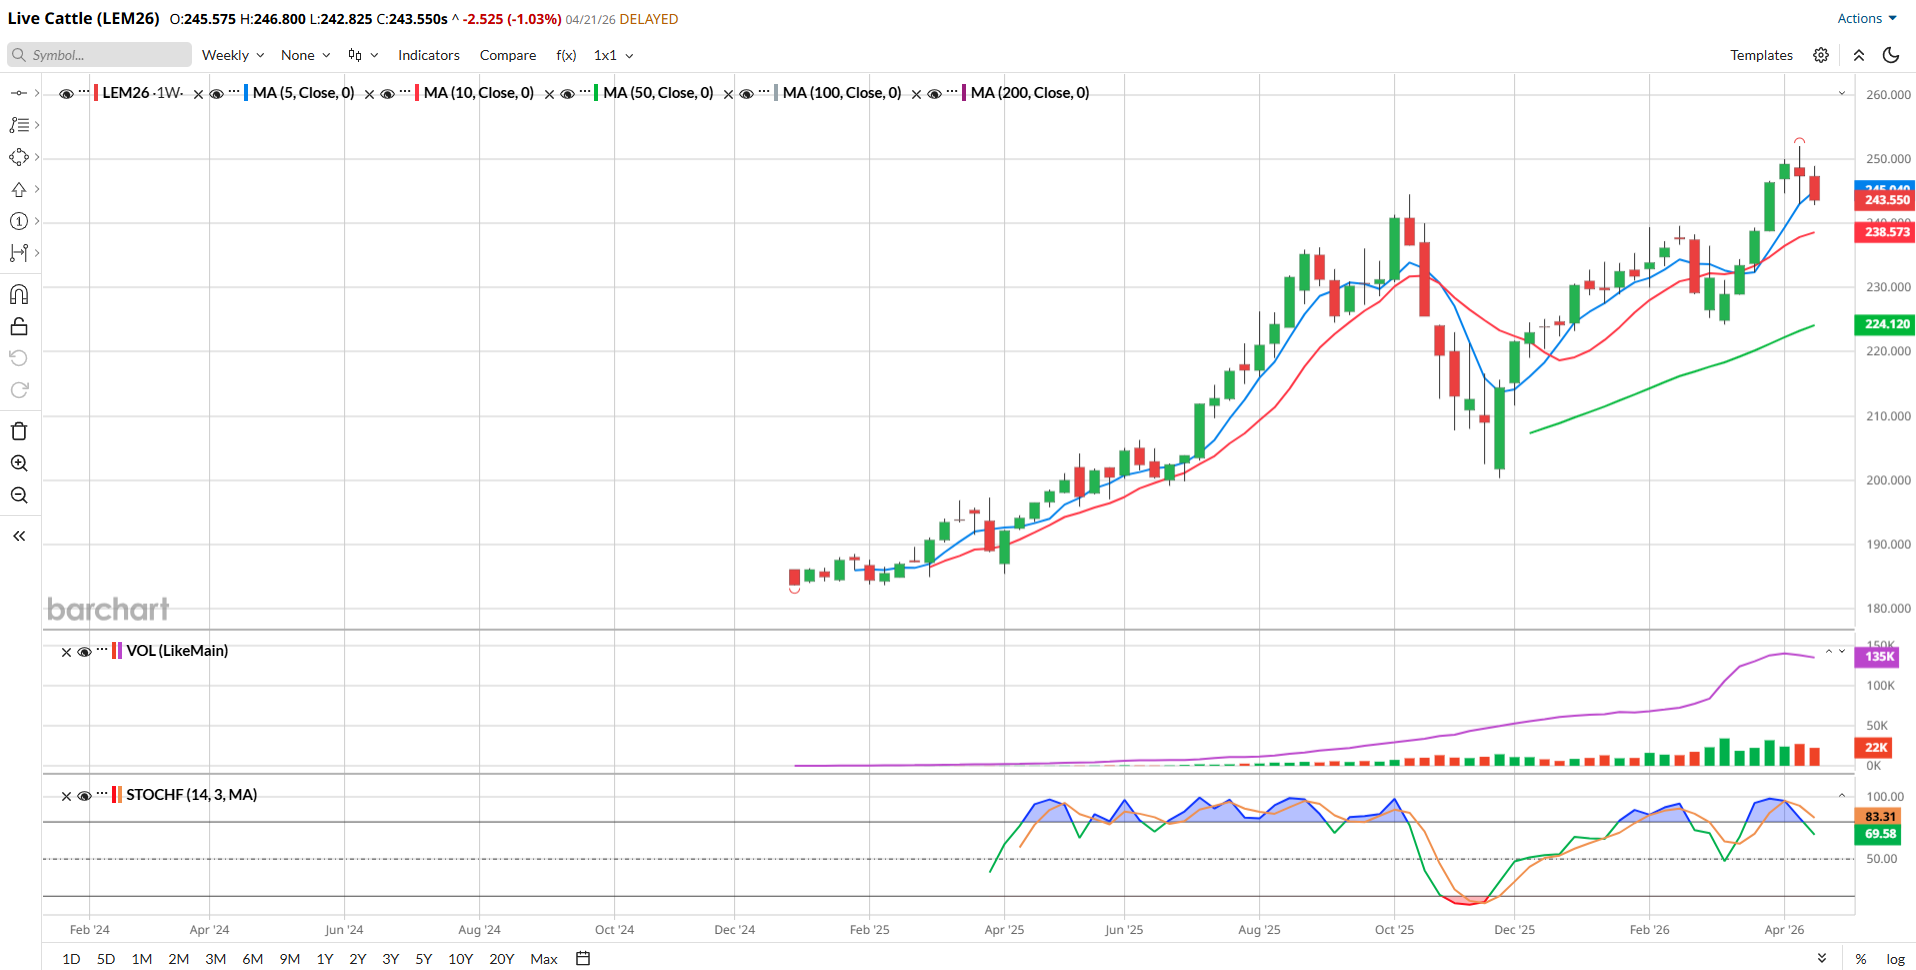
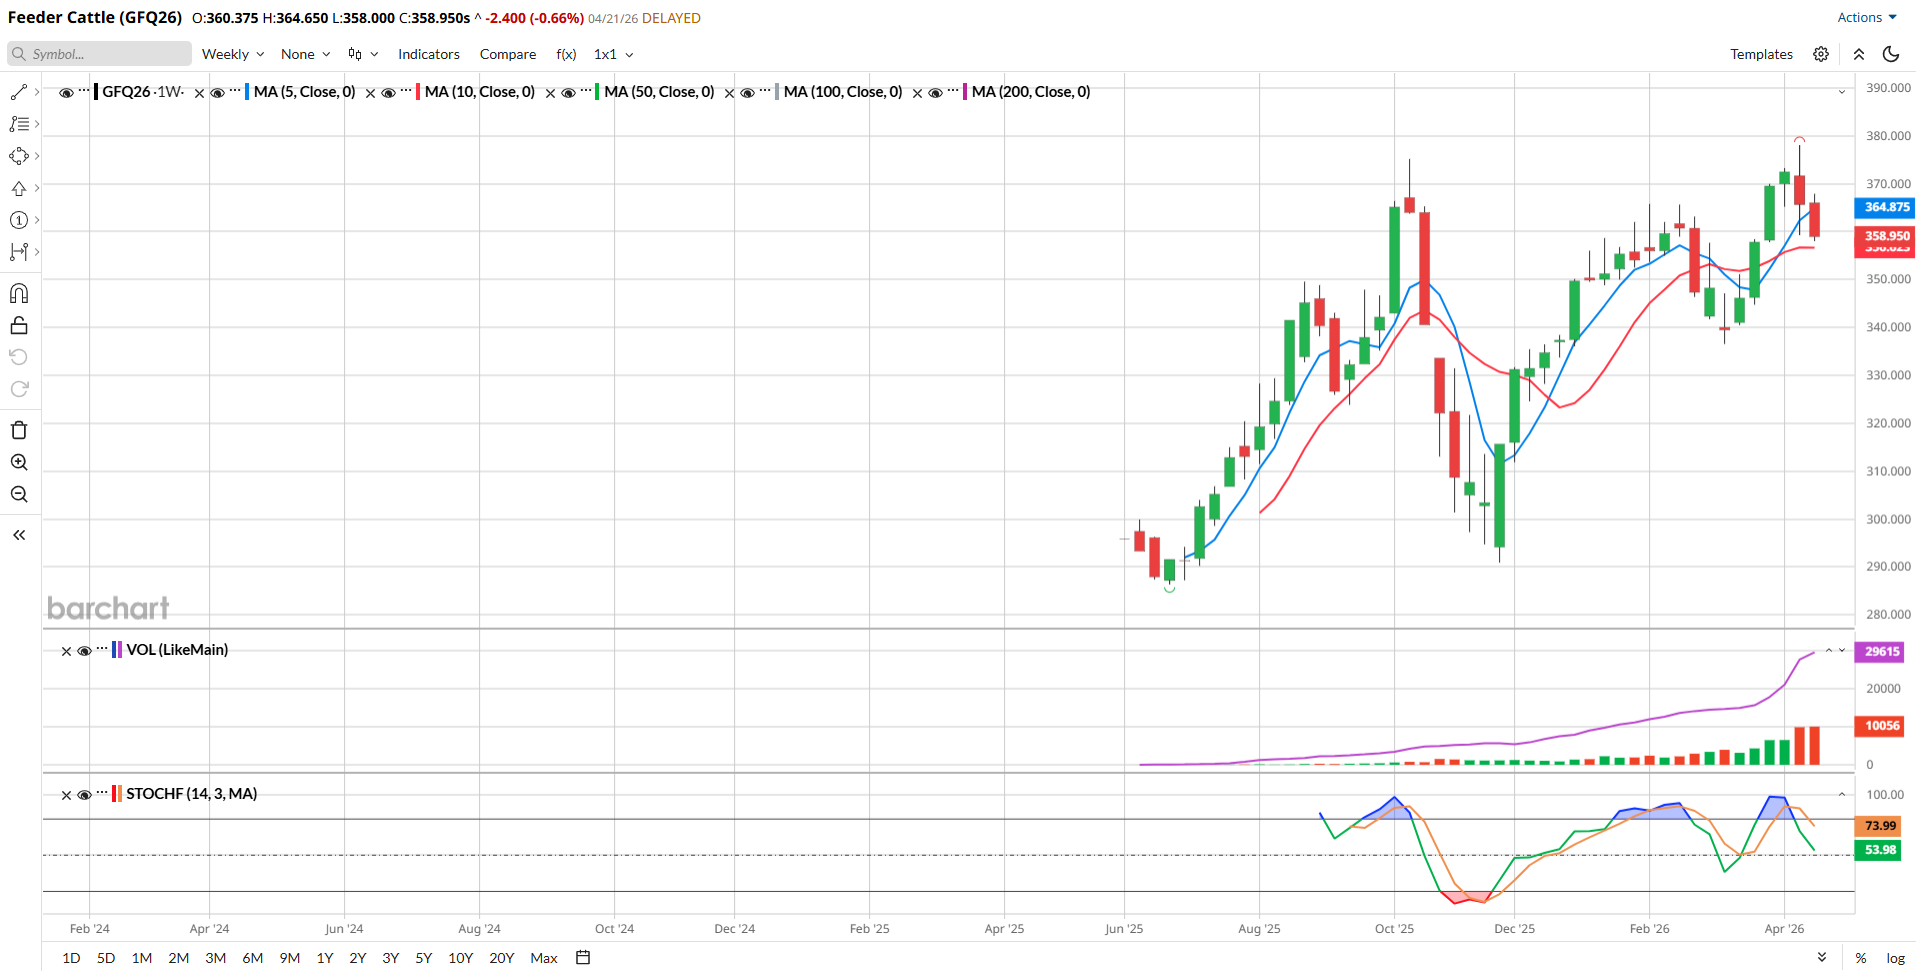
I think there might be a potential double-top in the weekly August Feeder chart above.
I don’t see that same type of formation in the Live Cattle, as they actually extended to new and higher highs for 2 weeks after they breached the October highs. Feeders have not. It is true that they pushed through the old high by almost 3.00, but they’ve failed to hold that gain and have now dropped some 9.000 from those highs.
As long as the March lows hold as support in Live (224.225) and Feeder Cattle (336.550) I’ll maintain my bullish stance (Less cattle and more people to feed) but if those lows are broken, I’d expect downside acceleration to occur.
Again, I haven’t turned bearish. I don’t expect this to turn into a washout to the downside. I think that both Fats and Feeders tend to go lower into mid-May, before resuming bullish trends. In the short-term, prices do appear as if they want to head lower.
Sign Up to receive Walsh Trading’s 1st Half of 2026 Market Outlook First Half of 2026 Outlook for the Livestock and Grain markets.
If you like what you’ve read here and would like to see more like this from Walsh Trading, please Click here and sign up for our daily futures market email.
Jefferson Fosse Walsh Trading
Direct 312 957 8248 Toll Free 800 556 9411
jfosse@walshtrading.com www.walshtrading.com
Walsh Trading, Inc. is registered as a Guaranteed Introducing Broker with the Commodity Futures Trading Commission and an NFA Member.
Futures and options trading involves substantial risk and is not suitable for all investors. Therefore, individuals should carefully consider their financial condition in deciding whether to trade. Option traders should be aware that the exercise of a long option will result in a futures position. The valuation of futures and options may fluctuate, and as a result, clients may lose more than their original investment. The information contained on this site is the opinion of the writer or was obtained from sources cited within the commentary. The impact on market prices due to seasonal or market cycles and current news events may already be reflected in market prices. PAST PERFORMANCE IS NOT NECESSARILY INDICATIVE OF FUTURE RESULTS. All information, communications, publications, and reports, including this specific material, used and distributed by Walsh Trading, Inc. (“WTI”) shall be construed as a solicitation for entering into a derivatives transaction. WTI does not distribute research reports, employ research analysts, or maintain a research department as defined in CFTC Regulation 1.71.