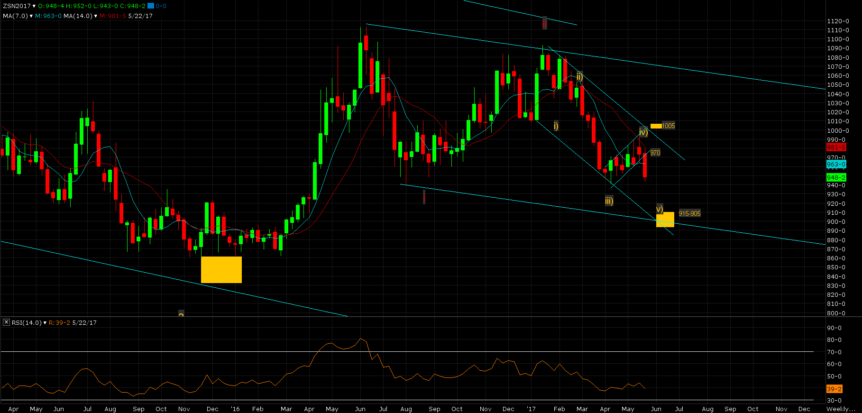
Soybeans Yesterdays post suggested that the weekly candle in place should have a propensity to close at or near the lows. Also indicated in the report was a probability that the weeks average 14 period range measurement (28) would increase. This scenario did indeed play out as Friday’s action saw continued selling pressure driving the price of the July contract to the mid 920.0’s. …
Markets move higher….just barely
Just a little bit Headed in to the holiday weekend, equity markets moved higher as if they were moving through Jell-O. Most of the day was spent in sideways back and and forth fashion. The S&P 500 closed up half a point, and the Dow went out 3 points higher than Thursday. That was seven straight higher closes for the …
US Corn Wave Analysis and Trade Setups
Corn Outlook Longer term wave structure lays out a reasonable scenario to follow. All directional analysis designed to develop a strategy are intended to define risk and maximize profits to achieve a favorable rate on investment (risk vs reward). No recommendations are made without these criteria. As it appears now studies suggest we could be entering another leg lower. …
Livestock Report
Live Cattle The August Live Cattle contract opened (120.45) higher on Thursday, May 25, 2017, and then traded down to the lows for the day at 119.375. It found support here, just above the Wednesday low (118.65) and took off trading to a new high (121.50) at the end of the trading session. The rally took price to the 121.45 …
July Corn Wave Breakdown 5/25
Corn An apparent b wave triangle formation exist in weekly timeframe. This pattern is a smaller structure in a larger ending diagonal in the final wave of completion. If this is the case, then the recent rejection off 380 should be followed by a violation of 364. In the event that this unfolds further weakness should ensue. These patterns can be a bit sloppy …
Soy Complex Wave Analysis 5.25
Soybeans A weak close going into final session of the weak. As discussed in previous posting, a bearish tone has been forecasted base on longer term wave structure. The weekly belt hold candle developing also suggest that Friday’s session closes at or near bottom of range. Weekly ATR of 30 has been achieved, however, It should be stated a rise of this indicator, current at lower end …
Equities hit new highs
Record Highs Strong day in the equities on Thursday as both the Nasdaq and S&P 500 put in new all time highs. The S&P 500 closed higher for the sixth session in a row, with the futures trading near 2413 on the close. The Dow futures were up almost 4% on the day, putting in a high of 21,095 before …
Oilshare-Beans meal, vertical down Stocks Vert UP.
In my view Stock bubble now in force, 1987 anybody? Aug 26th was it? Soybeans last few days had some fund guys trying to hold up this pig that is showing its true colors today, auto pilot selling next few days. Meal also. My timed interday meal (the way they hide it from you) has just gapped down explicitly when …
Livestock Report
Live Cattle The August Live Cattle contract opened (120.925) lower on Tuesday, May 24, 2017, and then traded down to the lows for the day at 118.65 (almost a limit down move), as expectations for a lower cash trade on the fedcattleexchange.com auction took hold and were then realized. Last week the auction saw sales between $133.75 and $135.75. This …
Soybean Update Wave Analysis 5-24
Soybeans Dominant timeframe structure remains bearish. Nearest downside support comes in at 925.0+-. Any follow thru targets 915-905. This area could produce a technical bounce. If so, a non-impulsive rally should play out and eventually give way to further weakness. Long term wave pattern suggest a downside objective to be fulfilled. Target zone extends to 825-750. A weekly close above 970 would suggest point to a modest advancement targeting +-1005.0. …

