
Tim Healy 9/17/2026
If you would like to receive more information on the commodity markets or would like to open an account, please give me a call or click the link below.
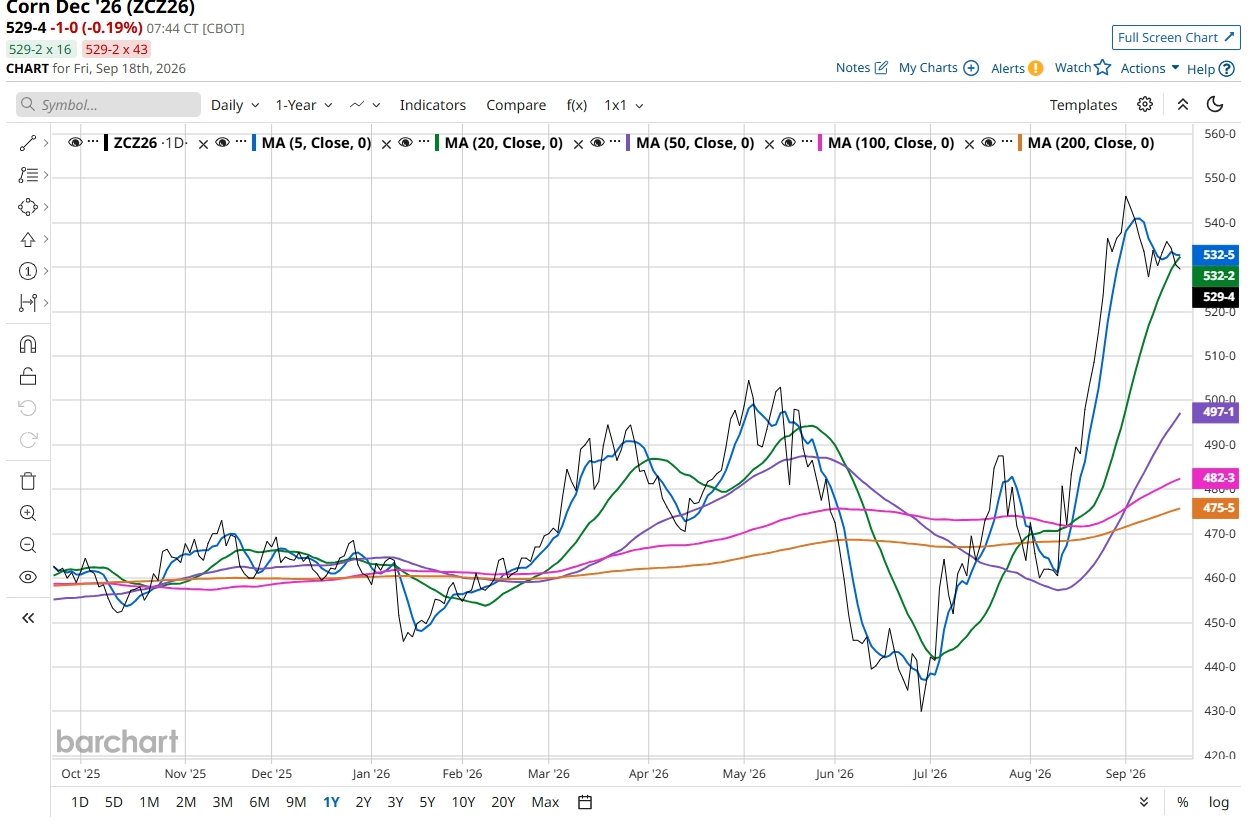
Corn Dec ’26 (ZCZ26)
Medium- to Long-Term Trend: Strongly Bullish
Price sits well above the major moving averages:
This confirms a sustained uptrend that began earlier in the year. The large positive price changes versus the longer MAs indicates strong accumulation.
Short-Term Trend: Corrective / Pullback
Price has fallen below both the 5-day MA (532-2) and the 20-day MA (530-7).
Short-term ADX remains elevated (9-day ADX 45.14, 14-day 42.21), showing the prior up-move still has momentum, but the immediate direction has flipped lower.
Higher-timeframe uptrend remains intact. The market is in a healthy pullback within that uptrend rather than a trend reversal.
Momentum & Oscillator Analysis
| Indicator | Reading | Interpretation |
| Stochastic (9/14) | %K 36–40, Raw Stoch very low | Short-term oversold |
| Stochastic (20+) | Still elevated (70–86) | Longer-term momentum still positive |
| RSI (all periods) | 50–59 | Neutral – neither overbought nor oversold |
| ADX + DI | Short-term ADX strong + +DI dominant; longer ADX weak | Short-term trend power fading; longer-term trend mature |
Short-term oscillators are washing out the recent excess, which is constructive for the larger uptrend. ATR is moderately volatile and contracting slightly on longer lookbacks (9-day ATR 11-3 → 100-day 8-4). Historic volatility rises with time frame (≈12% short-term → ≈21% on 50/100-day), typical after a strong directional move.
Key Support & Resistance Levels Resistance
Immediate: 530-7 to 532-2 (20-day & 5-day MAs) – first barrier on any bounce.
Next psychological / prior-swing area would be the recent highs (not shown on this table, but above 532).
Support Near-term: 520–525 zone (common retracement area in grain markets during pullbacks).
Stronger: 495-5 (50-day MA) – major support and the level that would need to break to question the medium-term uptrend.
Deeper: 482-0 (100-day) and 475-3 / 476-6 (200-day & YTD average).
Corn Dec ’26 remains in a strong medium-term uptrend but is undergoing a short-term corrective pullback. Momentum has cooled (price below 5- and 20-day MAs, short stochastics oversold), which is normal after the sharp advance from the 50-day MA area. Bullish scenario: Hold above the 50-day MA (≈495-5) and reclaim the 20-day MA (530-7).
Bearish scenario: Sustained break below the 50-day MA would signal a deeper correction or potential trend change. The current setup favors buyers looking for entries on dips toward the 50-day MA rather than chasing strength at current levels.
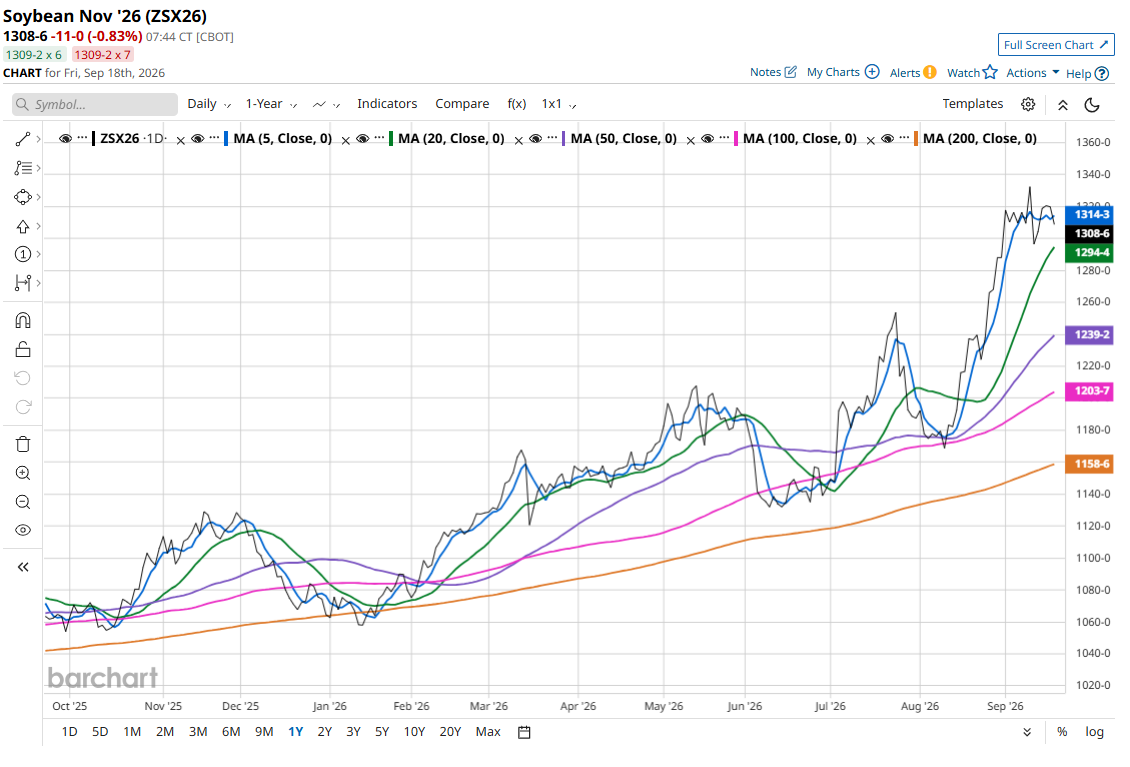
Soybean Nov ’26 (ZSX26)
Medium- to Long-Term Trend: Strongly Bullish
Price remains well above all major moving averages with solid gains:
| Moving Average | Level | Distance from Price | % Change |
| 5-Day | 1311-2 | Slightly above | −1.22% |
| 20-Day | 1290-6 | Above | +6.36% |
| 50-Day | 1236-6 | Well above | +10.38% |
| 100-Day | 1202-4 | Strongly above | +13.87% |
| 200-Day | 1157-7 | Strongly above | +16.61% |
| Year-to-Date | 1166-2 | Strongly above | +23.63% |
The market is in a clear intermediate and long-term uptrend. The largest relative strength is versus the longer-term averages (100-day, 200-day, and YTD).
Short-Term Trend: Mild Pullback / Consolidation
- Price has slipped just below the 5-day MA (1311-2).
- Still comfortably above the 20-day MA (1290-6).
- This is a shallow, orderly correction rather than a sharp reversal.
| Period | Stochastic Condition | RSI | Interpretation |
| 9-Day | Neutral (Raw 55%, %K 62%) | 61.3 | Healthy, not overbought |
| 14-Day | Moderately bullish | 63.3 | Positive momentum |
| 20-Day | Bullish (Raw 84%, %K 86%) | 63.5 | Still strong |
| 50/100-Day | Strongly bullish | ~59–61 | Longer-term momentum intact |
Short-term oscillators are in neutral-to-bullish territory and far from oversold. This suggests the current dip is mild and the broader uptrend momentum has not been damaged.3. Trend Strength (ADX / Directional Indicators)
- 9-Day ADX: 46.66 (very strong) with +DI (25.60) significantly above −DI (8.87)
- 14-Day ADX: 37.53 (strong) — +DI still dominant
- 20-Day ADX: 28.23 (moderate-strong)
- Longer-term ADX drops to 13.20 (50-day) and 8.76 (100-day)
The short-term trend remains powerful and bullish. The longer-term ADX readings indicate the major advance has matured, which is normal after a sustained rally.
4. Volatility
- ATR is moderate: ~1.6–1.75% on short-term periods, declining to ~1.25% on the 100-day.
- Historic volatility sits in the 17–19% range — typical for soybeans and lower than wheat’s current readings.
5. Key Support & Resistance Levels Resistance
- Immediate: 1316–1320 area (recent pivot)
- Stronger: Recent swing highs near 1335
Support
- Near-term: 1311-2 (5-day MA) → 1290-6 (20-day MA)
- Major: 1236-6 (50-day MA) — key level that must hold to keep the medium-term uptrend fully intact
- Deeper: 1202-4 (100-day) and 1157-7 (200-day)
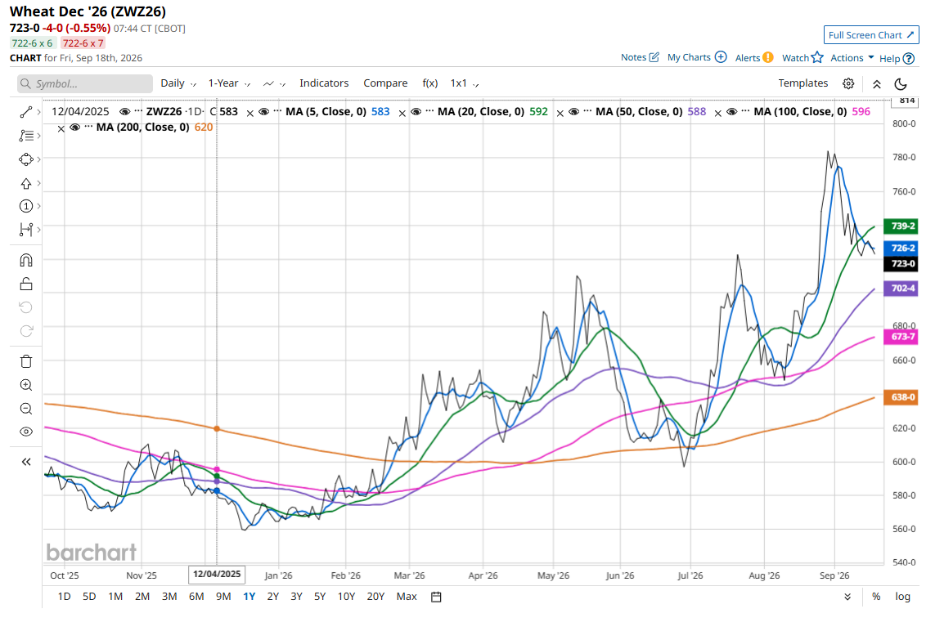
Wheat Dec ’26 (ZWZ26)
Based on technical indicators as of Thu, Sep 17, 2026
Last: 726-2 (−4-4 / −0.62%)
Medium- to Long-Term Trend: Strongly Bullish
- Price remains well above all major moving averages:
- 50-day MA: 700-6 (+3.64%)
- 100-day MA: 673-2 (+7.87%)
- 200-day MA: 637-3 (+13.94%)
- Year-to-Date average: 645-3 (+12.53%)
- This confirms a sustained uptrend with significant gains from earlier in the year / from the longer-term averages.
Short-Term Trend: Corrective Pullback / Consolidation
- Price is essentially flat vs the 5-day MA (726-1) but clearly below the 20-day MA (738-1).
- The market has given back some of the recent advance (price is still +3.84% above the 20-day MA).
Momentum Indicators
| Period | Stochastic Condition | RSI | Interpretation |
| 9/14-Day | Oversold (Raw 17–27%, %K low) | 46–51 | Short-term selling pressure washing out |
| 20-Day | Neutral-low | ~53 | Cooling after prior strength |
| 50/100-Day | Moderately bullish | ~54–55 | Longer-term momentum still intact |
Short-term oscillators are oversold, which is constructive within a larger uptrend
(potential for a bounce). Longer-term readings remain supportive but not overbought.
Trend Strength (ADX / Directional Movement)
Short-term ADX (9–20 day): ~21–22 → moderate / non-trending (no strong directional conviction currently).
+DI vs −DI is mixed-to-slightly negative on the very short term (9-day −DI edges higher), then flips positive on 20-day+.
Longer-term ADX is low (50-day 15, 100-day 10) → the big up-move has matured and the market is no longer in a powerful trending phase.
Volatility
ATR% is elevated (~3.2–3.4% on 9–20-day periods) compared with corn and soybeans.
Historic volatility is high (25–33%), indicating largery MA to 20-day MA).
A reclaim of the 20-day MA (738-1) would signal the short-term pullback is ending.
Support in near-term: Psychological

Tim Healy
Broker
Pure Hedge Division
Direct: 1 312 957 4731
WALSH TRADING INC.
311 S. Wacker Suite 540
Chicago, Illinois 60606
Walsh Trading, Inc. is registered as a Guaranteed Introducing Broker with the Commodity Futures Trading Commission and an NFA Member.
Futures and options trading involves substantial risk and is not suitable for all investors. Therefore, individuals should carefully consider their financial condition in deciding whether to trade. Option traders should be aware that the exercise of a long option will result in a futures position. The valuation of futures and options may fluctuate, and as a result, clients may lose more than their original investment. The information contained on this site is the opinion of the writer or was obtained from sources cited within the commentary. The impact on market prices due to seasonal or market cycles and current news events may already be reflected in market prices. PAST PERFORMANCE IS NOT NECESSARILY INDICATIVE OF FUTURE RESULTS.
All information, communications, publications, and reports, including this specific material, used and distributed by Walsh Trading, Inc. (“WTI”) shall be construed as a solicitation for entering into a derivatives transaction. WTI does not distribute research reports, employ research analysts, or maintain a research department as defined in CFTC Regulation 1.71.