
In my opinion
GOLD- Short term sell level just hit late 1262.40. This is live now, reversed down. I like less than $2 stop risk. This mkt could turn lower here for a trade. 1265-65.50 above, then over 1268.30 new buying should emerge technically. Public always seems to buy rallies.
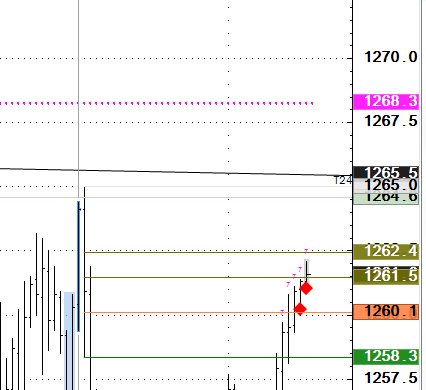
Thick olive is a sell, OLS. use a stop always. Red diamonds are a pattern of mine. I say accumulation but rules on what happens after. New high stop over 1262.40 if turns lower keeps risk tight and you fresh.
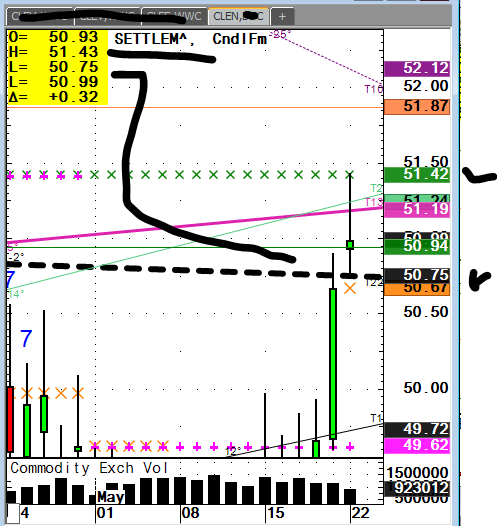
CRUDE OIL- see chart last week but resist above 51.42, 51.87, then olive sells 52.59 and 53.11. Write them down. 50.75 is huge macro pivot and todays low as well as Friday high late. 49.72 next downside # under that.
If you need a number and the mkt is ready to turn, these are how quants get levels in my opinion. I put trader methodology in explainable risk form.
COFFEE- 130.45 close. This mkt needs to demoralize longs imo, a little bit more but if looking to buy this falling knife 1st time 127.00 then a few cents lower so be ready when this breaks hard as is tendency. I like buying lower but not yet.
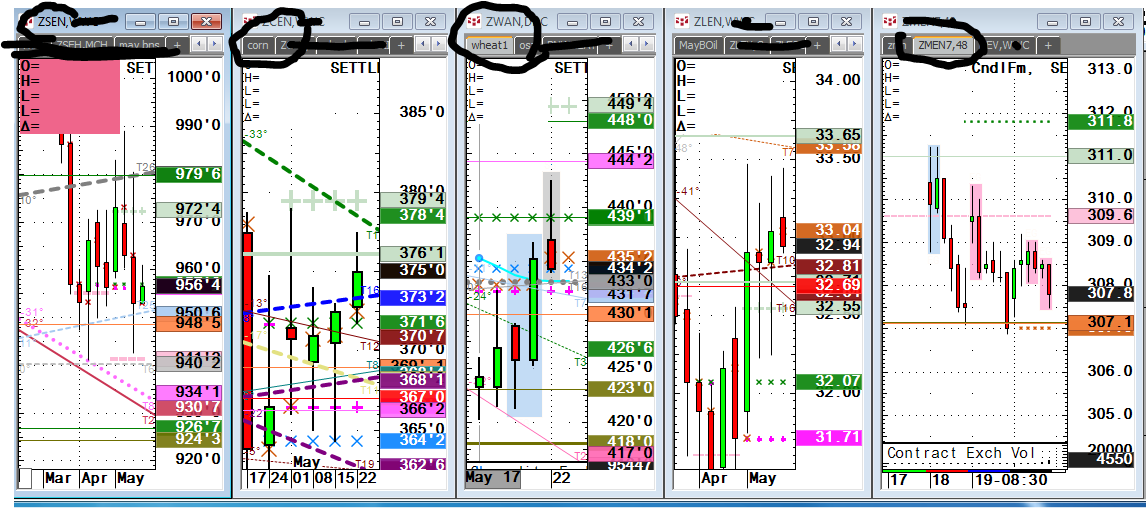
WHEAT 4.34 good pivot but caution now that we closed back at it. No axe to grind here $4.22 4.18 both solid support but 3rd time down is dangerous if playing naked long, less accurate compared to 1st time hits in my studies.
CORN-3.64 area to not be short over.
BEANS- No opinion but buy corn sell beans buy wheat sell beans seems a logical trade with replanting going to beans but who knows with GMO. 9.48 pivotal but I am only going to have buy levels going lower. If the market is going to bottom I put faith in my #s over anything else, 9.24-922 nest support.
MEAL – BEAN OIL- July meal has 307.10 as very pivotal and low today again. Bears can push under 307 as next support 3% lower around 296.00. Oil- lackluster session 32.50 is a high impact level with 3080-ish trendline support. OS oilshare lost ground today. If you would like a research chart let me know.
BONDS- 154.08 and 154.16 a few sell levels always with tight stops as we try to rally into an area last year that saw rates move 50 basis points. Stocks and bonds last 30 years both rallied and to me shows they move together over the long term. Higher rates cause inflation just as lower rates cause low inflation if your open to new thoughts.
NASD100- Live now, 5697 last and I have a sell level where shorts flip long or cover shorts at 5704.50 so if your looking to short Nasd100 this may be an area to watch now.
RUSSELL – this is how the olive buy works here. Sequence to reading chart buy levels here is
green 1st supp,
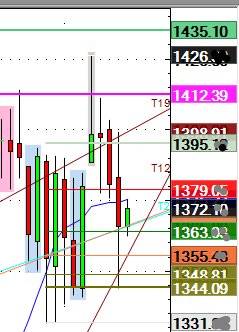
Russell stock index- 1344.09 is thick olive buy OLB.
orange next,
thin olive
then thick olive line at low is perfect example of the level that hurts the most people and an olive buy.