
The information and opinions expressed below are based on my analysis of price behavior and chart activity
June Live Cattle (Daily)
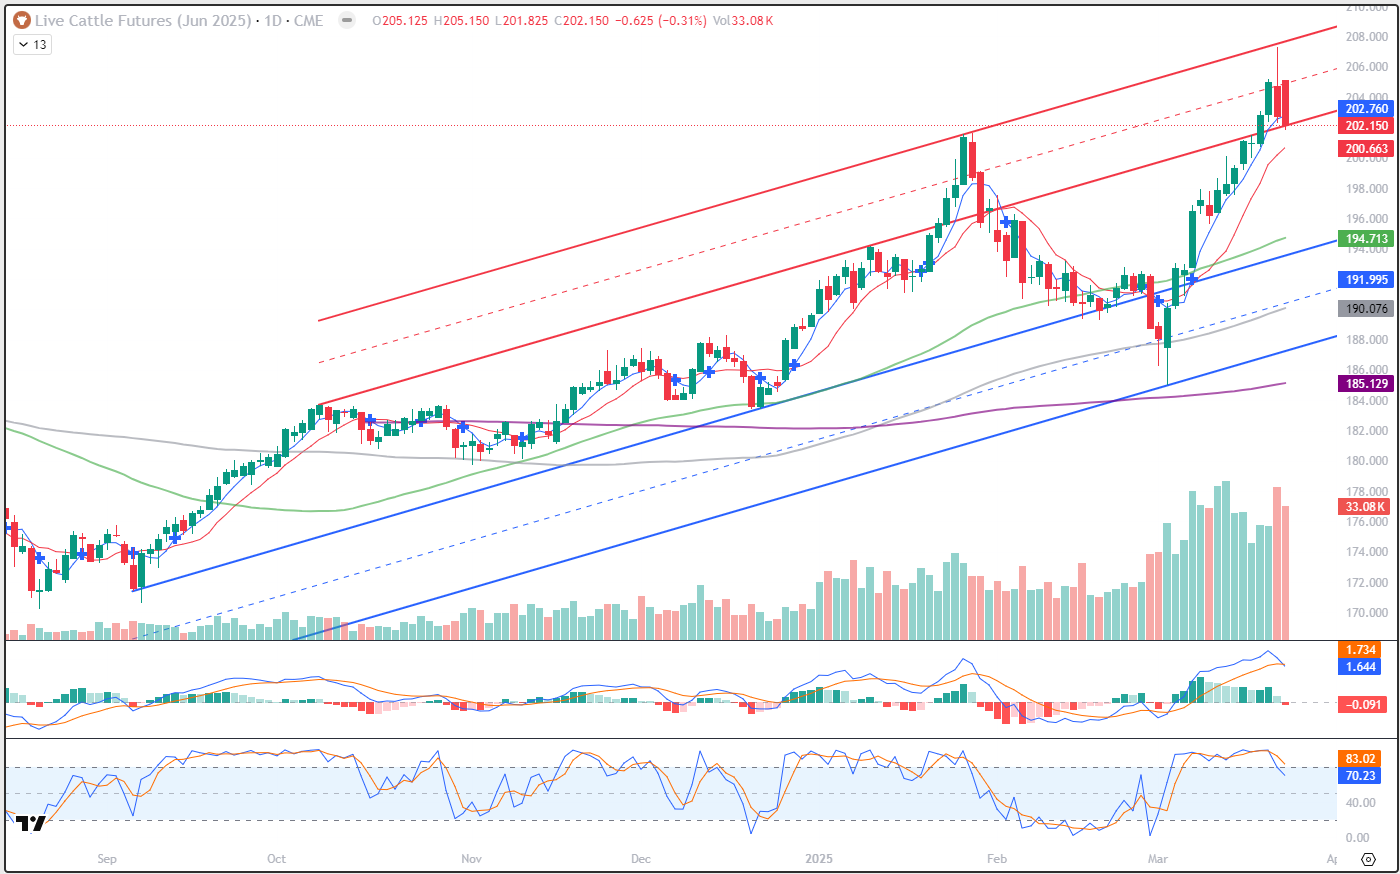
June Live Cattle closed at 201.150 today, down 0.625 from Friday. Friday afternoon, after the close, the USDA released the latest Cattle on Feed report. Measured against the same report last year, that pegged all cattle to be 2% less, cattle placed in feedlots 18% less and marketings 9% less. Fundamentally speaking, those numbers should be bullish. Technically speaking, the chart seems to tell a different story. Friday’s trade featured a large spike up to 207.300 and a close at 202.775, down 2.250 on the day and some 4.525 off of the daily/weekly high. By itself, Friday’s trade activity appeared to be a bearish reversal, before the COF data came out. Prices came very close to hitting the upper end of trendline resistance, much like they did in January, before reversing back down. Today, the market opened higher than Friday’s open and closed lower than Friday’s close, which should be a “textbook” bearish engulfment pattern. Monday’s close was also below the 5-day moving average (blue, 202.760) which may offer some overhead resistance now. The 10-day (red, 200.663) may offer some support before the 200.000 mark. Trade volume has been high over the past two sessions, typically indicating more selling pressure, I think. The Commitment of Trader data from last Friday’s normal, weekly, release seems to indicate that most large traders are net-long this market and added to their positions last week. If those longs decide to liquidate those positions, prices could drop in a hurry. Prices could very easily drop back to that 50-day moving average (green, 194.713 today) before finding significant support, which also coincides nicely with the blue trendline near 194.000. Both MACD and Stochastics (lower subgraph) are currently hooking lower from relatively high levels, indicating further price weakness is possible. We could be watching a “buy the rumor, sell the fact” trade work out in real-time. I think it’s likely that many traders were anticipating a “bullish” report. We’ve already seen some selling pressure after that report. I think we’ll see more, as almost anyone and everyone that has been a buyer since Thursday’s open is in a losing position and sometimes the most recent traders hold the weakest hands. The Cattle market may be a little overdone to the upside and in need of a correction.
June Live Cattle (Weekly)
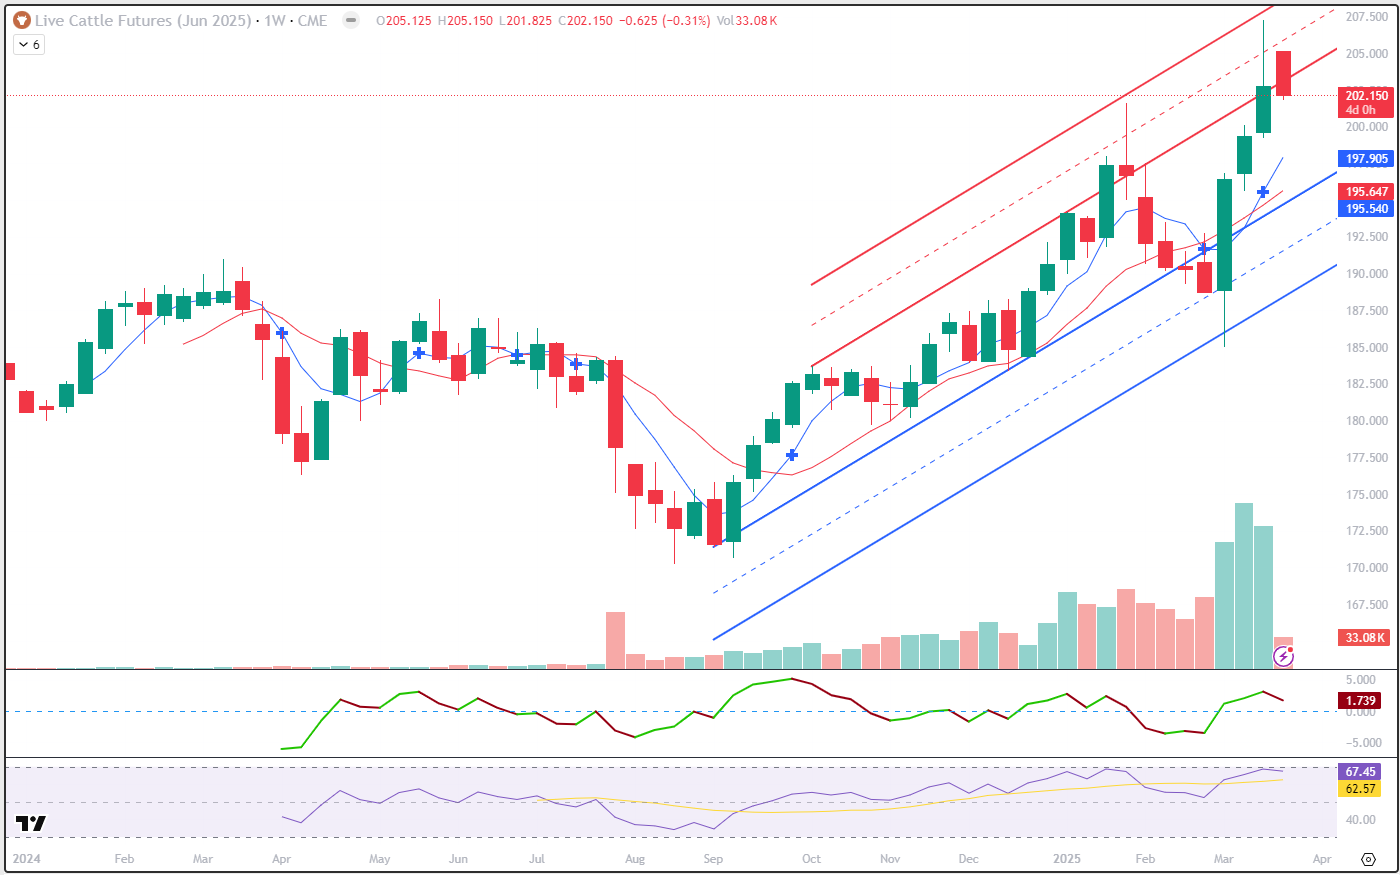
On my weekly chart of June Live Cattle, I’d like to point out a few things. First off, the market is clearly in an uptrend. However, last week’s high came very close to hitting the trendline resistance extension, much like it did with the previous spike high in late January. That set off 5 weeks of selling pressure before prices bounced off of the lower trendline extension. Last week’s trade, even though we saw higher highs and higher lows, was not friendly to prices, in my opinion. By finishing the week in the lower half of the trading range, and some 4.525 off the highs, that seems like evidence of profit taking, to me. Second, the 5-and 10-week moving averages crossed over into bullish territory last week. That’s denoted by the blue cross under last week’s bar. Those levels are near 197.905 and 195.647, respectively, today. (red/blue) Aggressive and well-margined traders with a long-side bias may do well to see how the market behaves if/when the market tests or trades near near that 10-week average. The Forecast Oscillator (1st subgraph) is currently pointing lower, and the weekly RSI, just below that, is weakening, as well.
June Live Cattle (Seasonal)
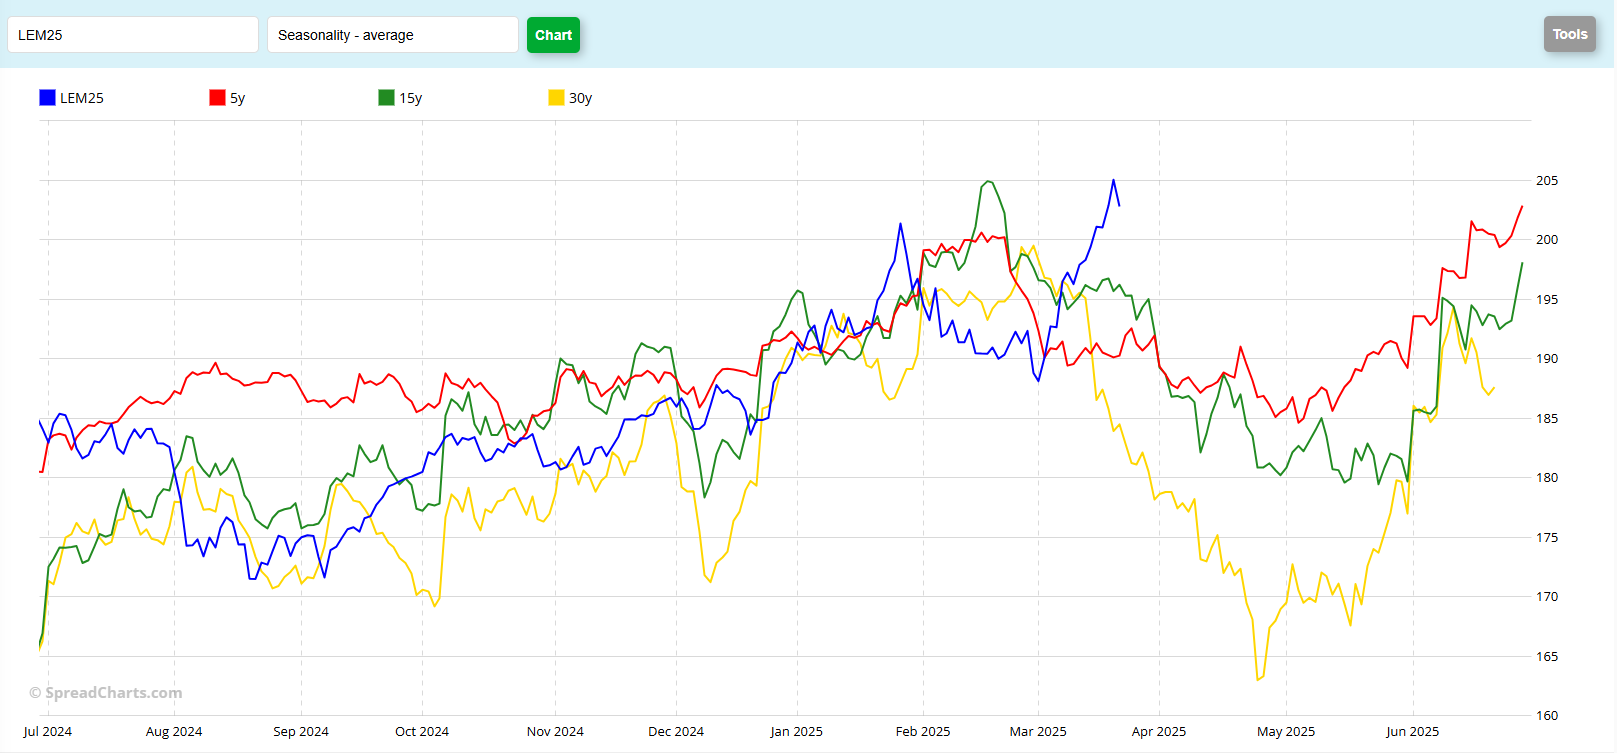
When looking at the seasonal chart, you might notice that the current contract (blue) is trading well outside the historical patterns. The 5-(red), 15-(green) and 30-year patterns (yellow) all suggest highs to be made in February, with trends that continue lower until the end of April or beginning of May. It would certainly appear that this year is out of sync with what the market has typically done in the past. If Friday’s high turns out to be the peak of the market, perhaps that indicates that the current is trading behind the historicals by about a month. If that’s the case, will the weakness extend longer in time on the way down? What do you think you see here?
Jefferson Fosse Walsh Trading
Direct 312 957 8248 Toll Free 800 556 9411
jfosse@walshtrading.com www.walshtrading.com
Walsh Trading, Inc. is registered as a Guaranteed Introducing Broker with the Commodity Futures Trading Commission and an NFA Member.
Futures and options trading involves substantial risk and is not suitable for all investors. Therefore, individuals should carefully consider their financial condition in deciding whether to trade. Option traders should be aware that the exercise of a long option will result in a futures position. The valuation of futures and options may fluctuate, and as a result, clients may lose more than their original investment. The information contained on this site is the opinion of the writer or was obtained from sources cited within the commentary. The impact on market prices due to seasonal or market cycles and current news events may already be reflected in market prices. PAST PERFORMANCE IS NOT NECESSARILY INDICATIVE OF FUTURE RESULTS. All information, communications, publications, and reports, including this specific material, used and distributed by Walsh Trading, Inc. (“WTI”) shall be construed as a solicitation for entering into a derivatives transaction. WTI does not distribute research reports, employ research analysts, or maintain a research department as defined in CFTC Regulation 1.71.