
The information and opinions expressed below are based on my analysis of price behavior and chart activity
June Live Cattle (Daily)
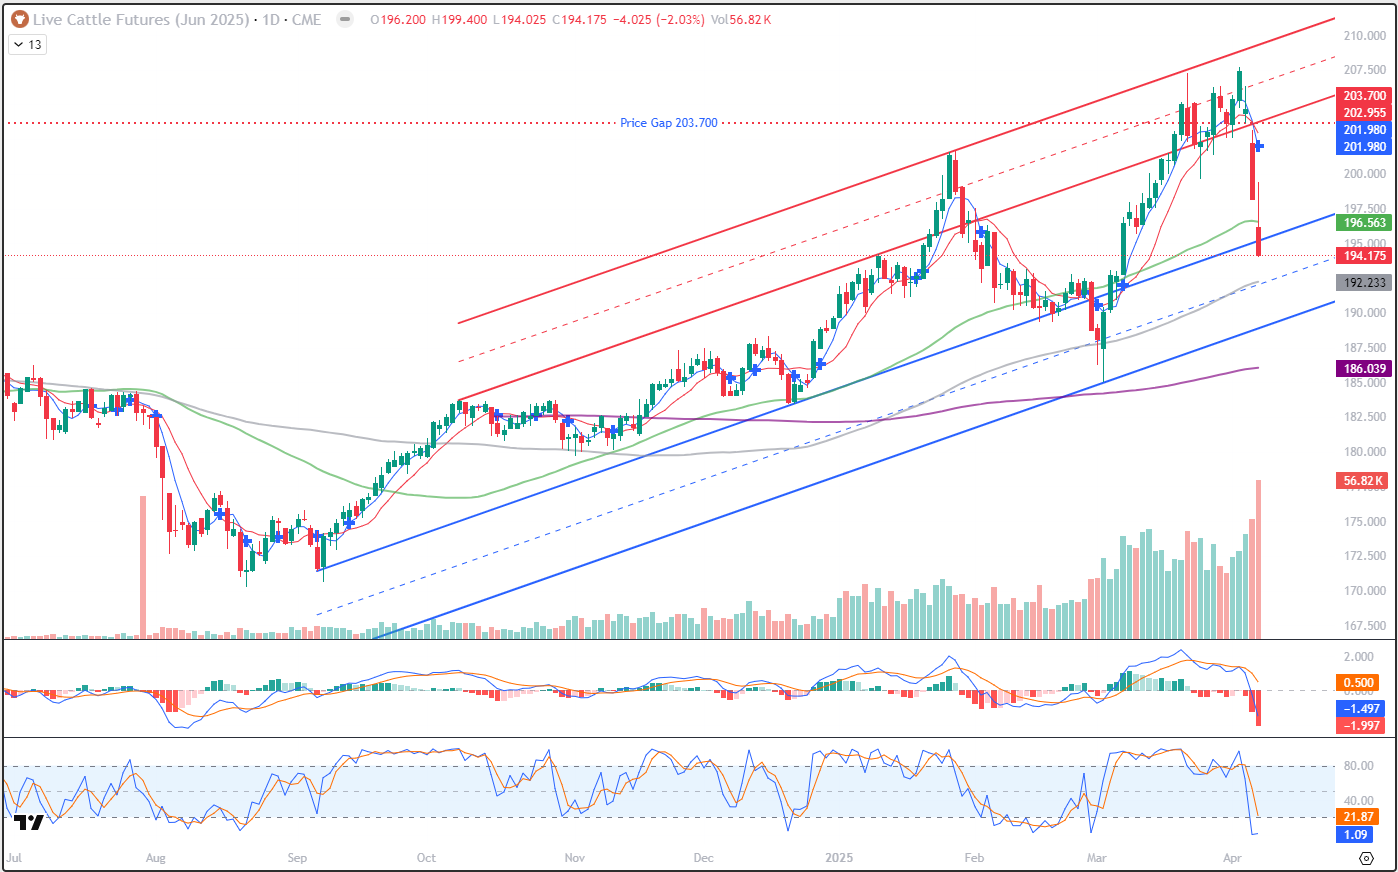
Following Friday’s limit-down close, June Live Cattle closed down 4.025, at 194.175. As futures did not settle at limit, one way or another today, there will be normal trading limits for Tuesday’s trade. Monday’s trade opened at 196.200, below the green 50-day moving average at 196.56 or so. That did leave a large gap on the chart, but prices rallied this morning on “fake news” and filled that gap. There is still a gap up above, at 203.700. That’s left there from last Thursday-Friday, and would, at some point, be a reasonable upside target. Selling pressure did re-appear and the Live Cattle were setting new daily lows into the close. In just 4 sessions, we’ve seen June Cattle go from a contract high close of 207.400 last Wednesday, to today’s close, dropping over 13.000. That doesn’t seem very friendly or bullish for prices, I think. My short-term moving averages (5-day, 10-day, blue/red) hooked to the “sell side” on my chart today, as denoted by the blue cross above today’s bar. Volume was high today, with 56,800 contracts traded in the June contract, exceeding Friday’s limit-down volume of about 42,800 contracts. High volume on a day that closes at (or near) the lows, usually suggest more weakness ahead. Fund-traders have been long this market, as shown through the Commitment of Traders data, for some time now. Almost anyone that has bought June Live Cattle since March 7th is in a losing position right now, and that may spur some margin liquidation, further pressuring prices. Overall, the trend is still up. The 100-day moving average (grey) may offer some support near 192.250, or so. Aggressive and well-margined traders may do well to consider establishing new long positions at or near that level. Coincidentally, I think that matches up well with the mid-range of the lower trendlines (blue) One reason that I think there may be support there is because the upper end mid-range acted as defacto resistance over the past couple of weeks. Of course, if the funds and all of the “long” traders decide to run for the exits, that could push prices well below those levels. For that reason, I would suggest using Put options, with the proper delta position sizing, should you choose to buy into the Cattle futures. The Puts may protect your account equity better than a straight sell-stop order might. Stochastics (lowest sub-graph) are about as oversold as they can get but they’re only been oversold for a day or two. MACD, just above that, has been in the red and declining since March 24th.
June Live Cattle (Weekly)
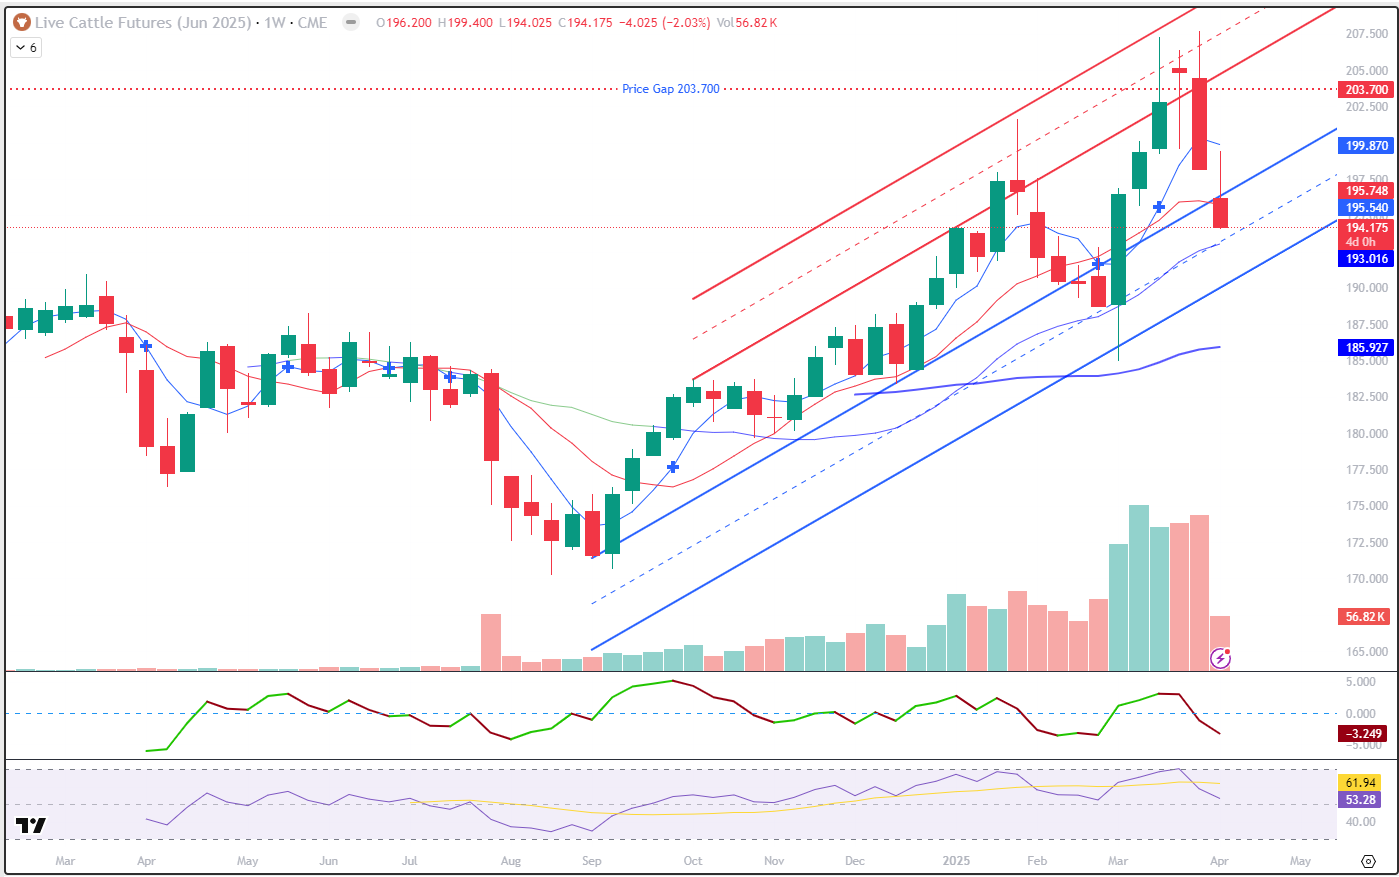
The weekly chart does not contain a price gap, but it is noted on the chart above. Over the past 4 weeks (bars) Live Cattle have set new contract highs, seemingly paused the next week and appeared to lose upward momentum, only to set a new contract high last week and close on the lows of the week. This week has started with a sharply lower open, but any gap on the weekly chart was filled by today’s trade activity. It’s only Monday, so it may be a bit early in the week to take a clue from the current bar, but the weekly chart is looking heavy (bearish) to my eye. The 5- and 10-week moving averages are now above the market, offering potential resistance near 199.87 (blue, 5-week) and about 195.75 (red, 10-week) The 20-week (also blue) is offering potential support below the market, and that aligns nicely (and coincidentally) with the mid-range dashed blue line , drawn from a trendline extension on the Sept-Dec lows. That may offer a decent support level, as you might notice that the previous 3 weeks, and their respective highs, ran into resistance at the upper-end mid-range. As bearish as the last few days have been, the weekly trend is still up, in my opinion, and it would take a close below the 50-week average support level (darker blue, 185.927) or the March low (185.00) to change the trend.
June Live Cattle (Seasonal)
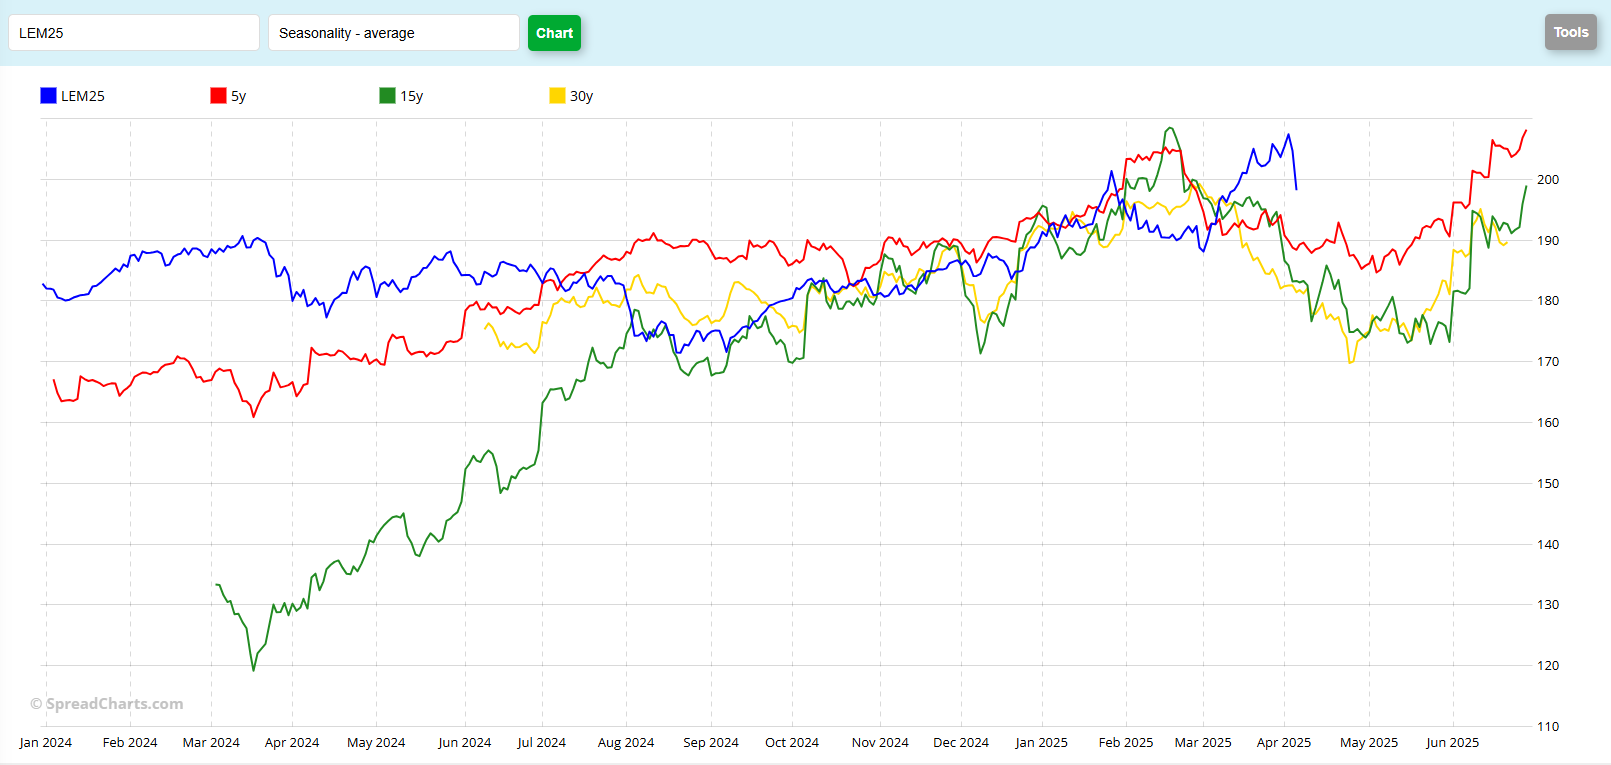
To my eye, the seasonal chart suggests some price weakness ahead. The 5-year (red), 15-year (green) and 30-year (yellow) patterns all suggest prices trend lower until late April or early May. However, I can also make the argument that this market (among others) has not really held to the typical seasonal tendency. This year’s (blue) apparent peak came about 6 weeks later than historical data implies. And prior to the last two sessions of price weakness, Cattle closed at a contract high close. What do you see? Is this the beginning of a seasonal sell-off, or a buying opportunity in a bullish trend?
Jefferson Fosse Walsh Trading
Direct 312 957 8248 Toll Free 800 556 9411
[email protected] www.walshtrading.com
Walsh Trading, Inc. is registered as a Guaranteed Introducing Broker with the Commodity Futures Trading Commission and an NFA Member.
Futures and options trading involves substantial risk and is not suitable for all investors. Therefore, individuals should carefully consider their financial condition in deciding whether to trade. Option traders should be aware that the exercise of a long option will result in a futures position. The valuation of futures and options may fluctuate, and as a result, clients may lose more than their original investment. The information contained on this site is the opinion of the writer or was obtained from sources cited within the commentary. The impact on market prices due to seasonal or market cycles and current news events may already be reflected in market prices. PAST PERFORMANCE IS NOT NECESSARILY INDICATIVE OF FUTURE RESULTS. All information, communications, publications, and reports, including this specific material, used and distributed by Walsh Trading, Inc. (“WTI”) shall be construed as a solicitation for entering into a derivatives transaction. WTI does not distribute research reports, employ research analysts, or maintain a research department as defined in CFTC Regulation 1.71.