
The information and opinions expressed below are based on my analysis of price behavior and chart activity
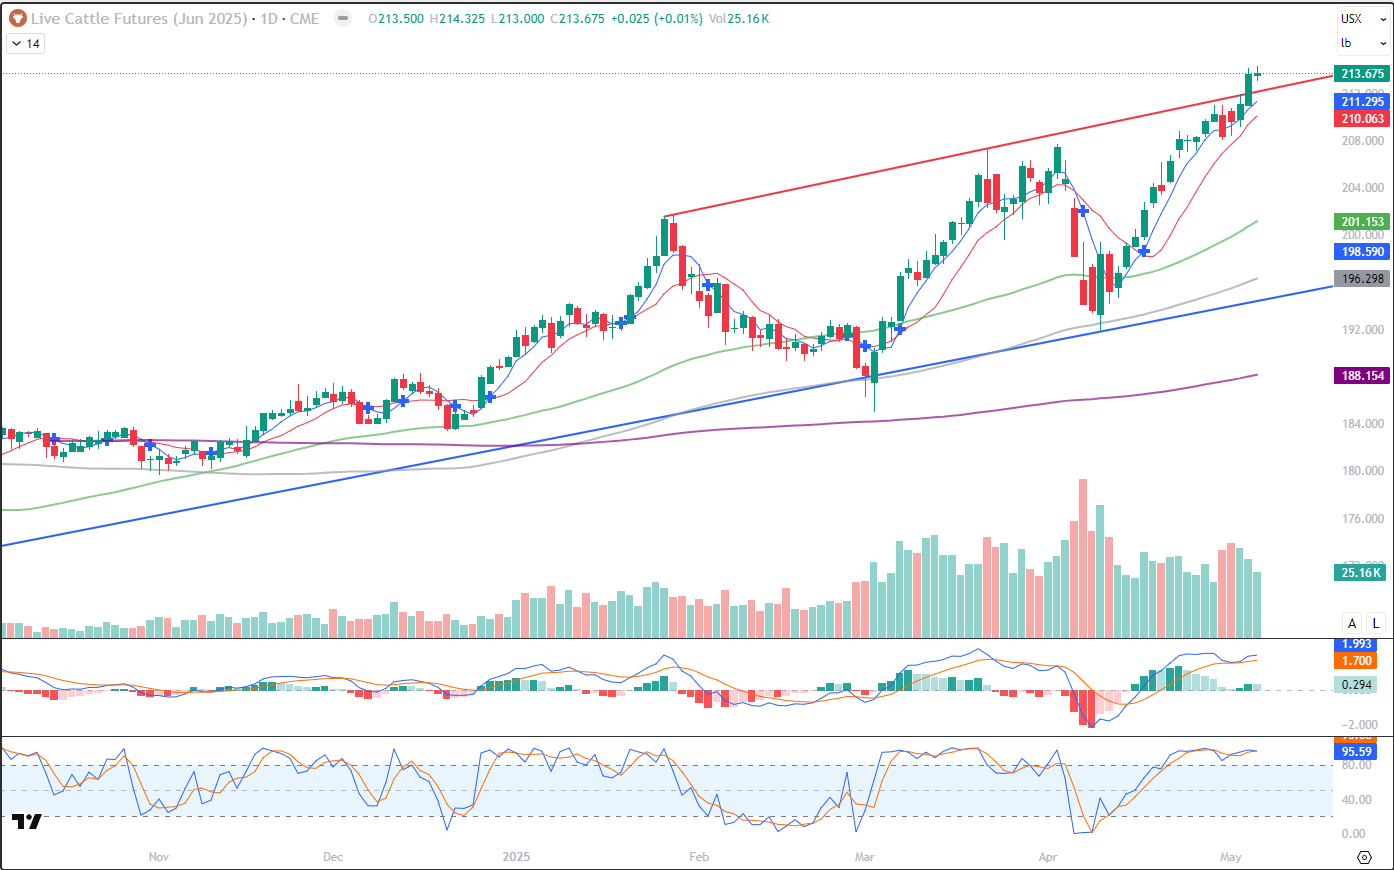
June Live Cattle (Daily)
I wrote about Live Cattle here in this space a few weeks ago. If you like, you can revisit those comments from April 17th here.
June Live Cattle closed at 213.675 today, gaining only a single tick (+.025) on the day. The market did set another new contract high, trading up to 214.325, before settling back to close roughly mid-range. And today’s range was fairly narrow, compared to recent trading ranges, at just 1.325 from low to high (214.325 to 213.000.) Last week’s trade saw new contract highs on three days and so far this week, the market is 2 for 2. The trend is clearly up, but may be losing some momentum. But today was “Turnaround Tueaday”, so it is likely early to call the top in the market. Monday’s trade saw the prices break out, decisively I think, above the grey trendline on the upper end of the chart. Friday’s close was also above that level, but yesterday was a very strong push. Stochastics, in the bottom subgraph, are overbought and have been that way since April 22nd. If you look back over the chart, I think you’ll notice that a market can stay overbought/oversold for extended periods of time. I know that it’s tough to see on the image above, the two lines that make up the Stochastic did make a slightly bearish crossover today. The short-term moving averages, the 5- and 10-day, are still in bullish territory and inclined higher. (blue, red, 211.295 and 210.063, respectively.) The longer-term averages on this chart, 50-day (green) 100-day (grey) and the 200-day (purple) are all well below the market and may offer support, should the market start to retrace. Cattle producers should be happy with these high price levels, although many of the ranchers that I speak with are very worried that it may not last. I get that point of view, as I’ve learned over the years that markets tend to fall faster than they rally and those concerns are warranted. But I’m a long way from getting bearish. The monthly Cattle on Feed numbers (next report on 4/23) have shown that that the national head count is still contracting. There were some, very preliminary, signs of heifer retention in the last COF data. Until heifers start to be held back in greater numbers still, the contraction will continue and the uptrend in prices should continue. Is the market due for a pullback? Perhaps it is. Does it “have to” pullback? No. To my eye, if prices start to head lower, barring any outside influence, I would expect the big, fat, round number of 200.000 to hold, if it even gets that far. Aggressive and well-margined traders may do well to consider establishing long futures positions in June Live Cattle. I would look for initial support levels near the 5- or 10-day averages (211.275 or 210.075.) Beyond those levels, perhaps the 210.000 may be support, or the March contract high of 207.725. Producers that have cattle going to market within the next month, may do well to consider strategies in the Put Options. Something like a June 212 Put, settled at 2.45 today or $980 before commissions and fees. The June options have 31 days remaining until expiration.
June Live Cattle (Weekly)
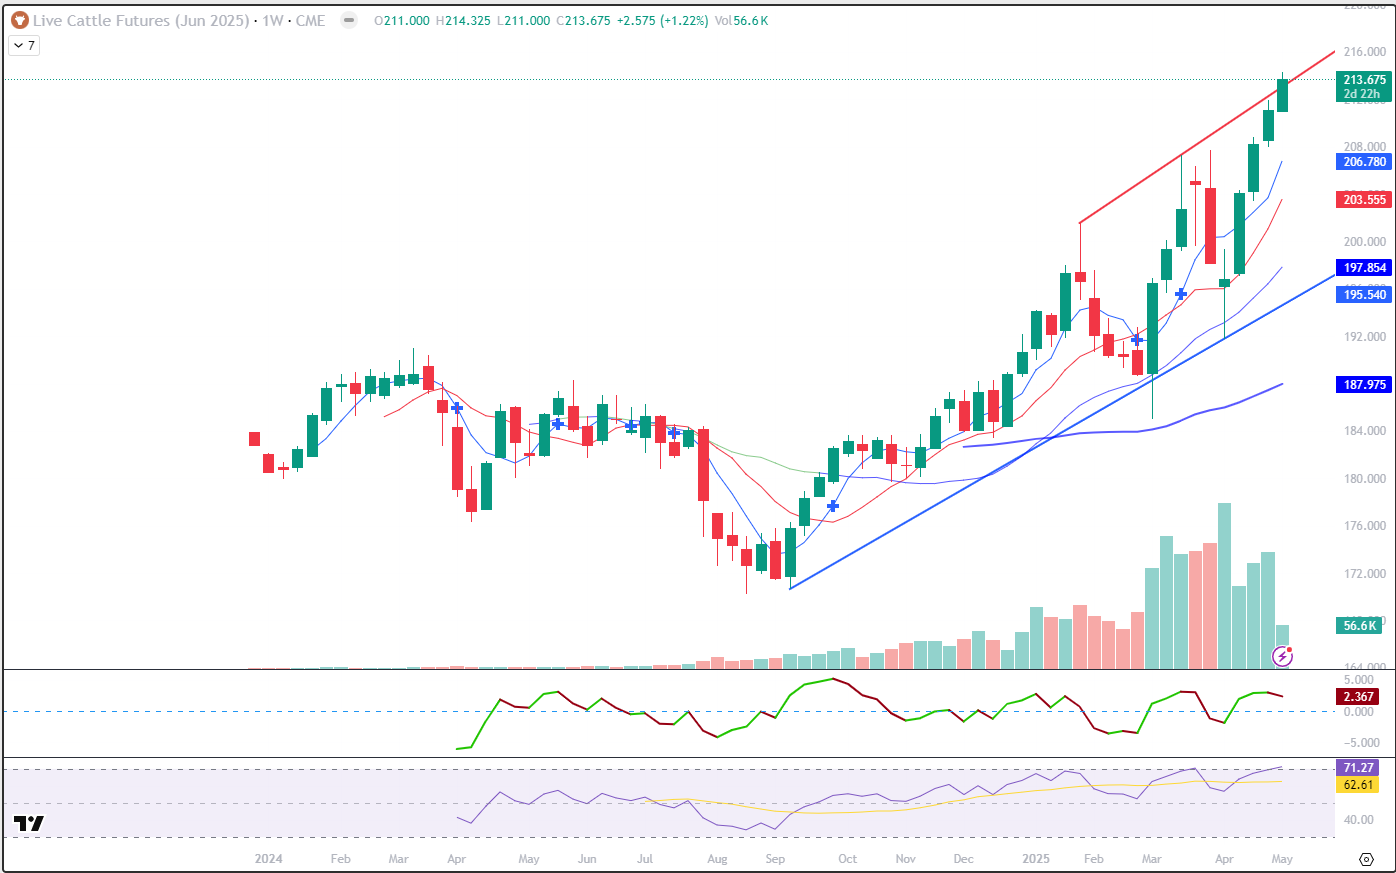
The weekly June Live Cattle chart looks strong, to me. As of today’s trade, the market is working on the 5th consecutive “green” bar and the 4th consecutive week of gains. If you look back over the chart above, you might notice that this contract has only strung together 5 consecutive weeks of gains only one time, in Sept-Oct of 2024. And 4 weeks of gains also happened on 2 occasions, both shortly after the contract launched. Most of the time, it’s been a 3-week streak, if at all. The cash trade remains strong, as evidenced by the Boxed Beef Index continuing to set new highs. You can find that index here The moving averages on the chart (5-week, 10-week and 50-week, red, blue, green, respectively) are all pointing higher. The nearest is the 5-week near the 206.775 level. Overhead resistance is anybody’s guess, I think, but I would look toward the 215.000 or 220.00 levels. Stochastics are overbought, but this weekly chart has maintained that condition for extended periods, as you might see from the October-January time frame. The market has broken out above the upper trendline (roughly 210.000 today), and the lower trendline is way down near 195.000. As long as US consumers are willing to pay higher costs for beef, and there is no “outside influence” (think COVID, war, outlying swan events) on the cattle markets I would expect prices to continue higher.
Jefferson Fosse Walsh Trading
Direct 312 957 8248 Toll Free 800 556 9411
jfosse@walshtrading.com www.walshtrading.com
Walsh Trading, Inc. is registered as a Guaranteed Introducing Broker with the Commodity Futures Trading Commission and an NFA Member.
Futures and options trading involves substantial risk and is not suitable for all investors. Therefore, individuals should carefully consider their financial condition in deciding whether to trade. Option traders should be aware that the exercise of a long option will result in a futures position. The valuation of futures and options may fluctuate, and as a result, clients may lose more than their original investment. The information contained on this site is the opinion of the writer or was obtained from sources cited within the commentary. The impact on market prices due to seasonal or market cycles and current news events may already be reflected in market prices. PAST PERFORMANCE IS NOT NECESSARILY INDICATIVE OF FUTURE RESULTS. All information, communications, publications, and reports, including this specific material, used and distributed by Walsh Trading, Inc. (“WTI”) shall be construed as a solicitation for entering into a derivatives transaction. WTI does not distribute research reports, employ research analysts, or maintain a research department as defined in CFTC Regulation 1.71.