
The information and opinions expressed below are based on my analysis of price behavior and chart activity
April Lean Hogs
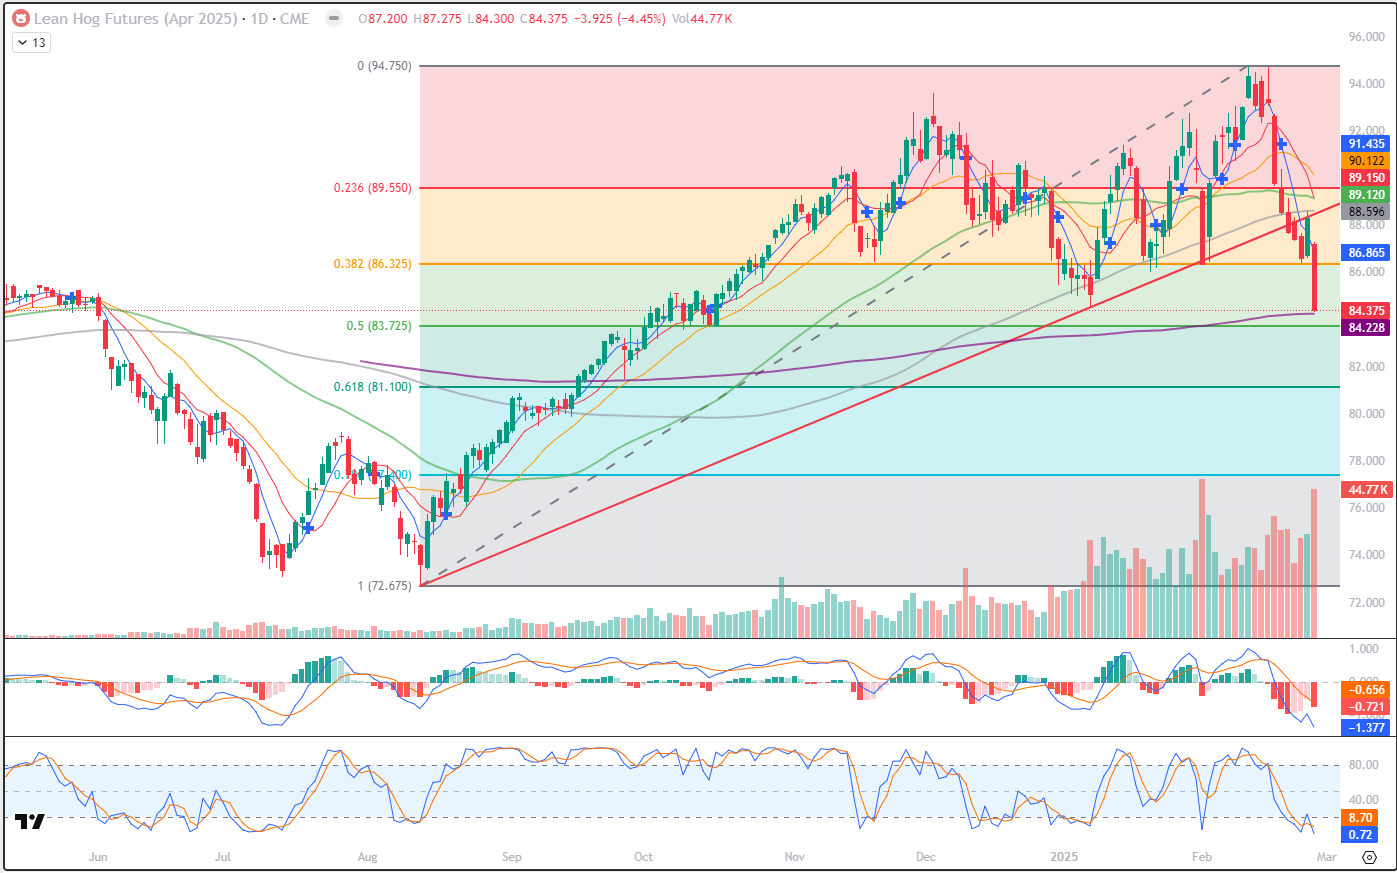
April Lean Hogs closed down 3.925 today, settling at 84.375. That puts prices just above the 200-day average (purple, 84.228). Volume was high today, which usually means position liquidation and further weakness ahead. However, tomorrow is Friday, Hogs are down aggressively for the past 2 weeks and some short traders may look to take a profit ahead of the weekend. That 200-day average may offer support, as might the 50% retracement level at 83.725. Coincidentally, there was also a period in the first 2 weeks of October that held these support levels, The daily limit in Hogs is 4.000, which was hit, but prices bounced off that by 3 ticks at the close and they did not settle at limit. The last time Hogs made a limit move was on Feb 3rd. That put them right on trend support, the red horizontal, and prices started a rally to new highs beginning the very next session. I’m not of the opinion that a huge rally will result just yet, but it may be enough of a rally to effectively sell into. Some of this weakness is technical, as support levels have been broken and some long traders have been exiting positions. The rest of it, I think, can be placed on tariffs. Allegedly, 25% tariffs will be imposed on imports of ANY product imported from Mexico and Canada along with 20% tariffs on products from China. That may well reduce some export demand and/or cause retaliatory taxes to be placed on our exports to those countries. Those countries are numbers 1, 4 and 5 for our Pork export market. Stochastics and MACD, in the subgraphs, are both pointing lower at the close. The MACD is roughly the widest (lowest) it has been since last July, and the Stochastic reading is at the lowest point on the chart, at 0.72 and 8.70. Resistance might be found near the January Low, at 84.500, the 38% Fibonacci level at 86.325. Beyond that, the 5-day average (blue) at 86.865, trendline near 88.450 the 100-day average (grey) at 88.595 might be resistance levels. Those last 3 are for reference, as they are out of the possible range for tomorrow. At this moment, the Hog market looks bearish to my eye, and it is very close to breaking it’s uptrend.
April Lean Hogs (Weekly)
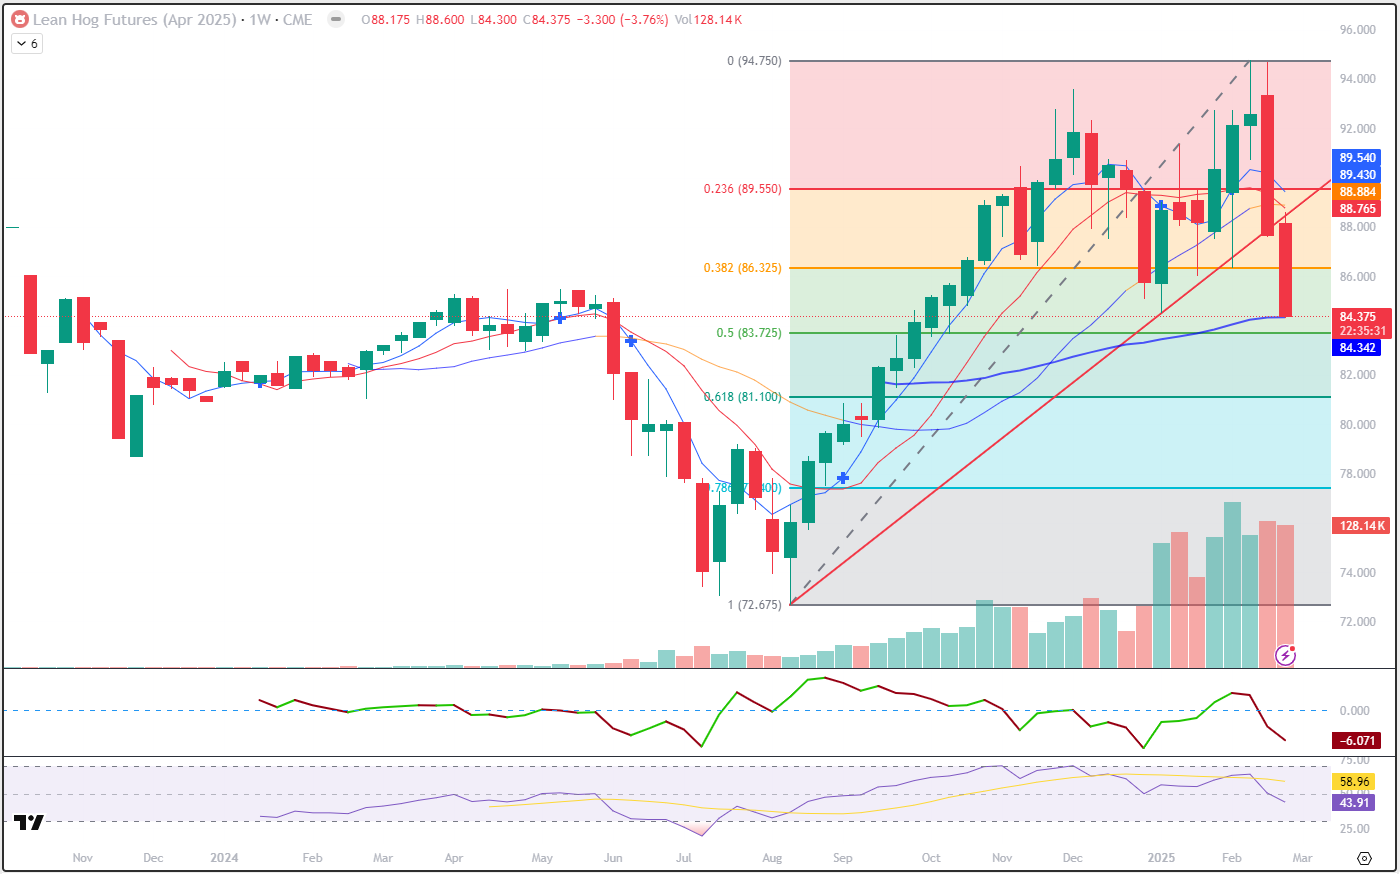
Last week, Hog prices fell by 4.925, week to week, but were 7.100 off the high. So far this week, they are down 3.300, 4.225 from this week’s high. Volume this week has almost matched last week and there’s still another day left to trade. Prices are currently just above the 50-week moving average (blue) at 84.342 and this would be the lowest weekly close since the last week of September. And prices are roughly right in the middle of the consolidation range from last March-May. The last two weeks are big, red bars and seem to point toward more selling. But if you look back, Hogs have not strung together more than 2 red weeks since last February. While the momentum appears to be on the bearish side, it’s quite possible that a small rally is in the cards as traders close out this month. As I mentioned above, some of this weakness is due to long liquidation, but the rest of it is due to tariff uncertainty. The 20-week average (was blue, changed to orange last week) is up near 88.88, slightly above the 10-week average (red) which is at 88.765. The market seems heavy and it’s got momentum. Do you think it will continue lower or is this a buying opportunity just 3 weeks removed from contract highs?
April Lean Hogs (Seasonal)
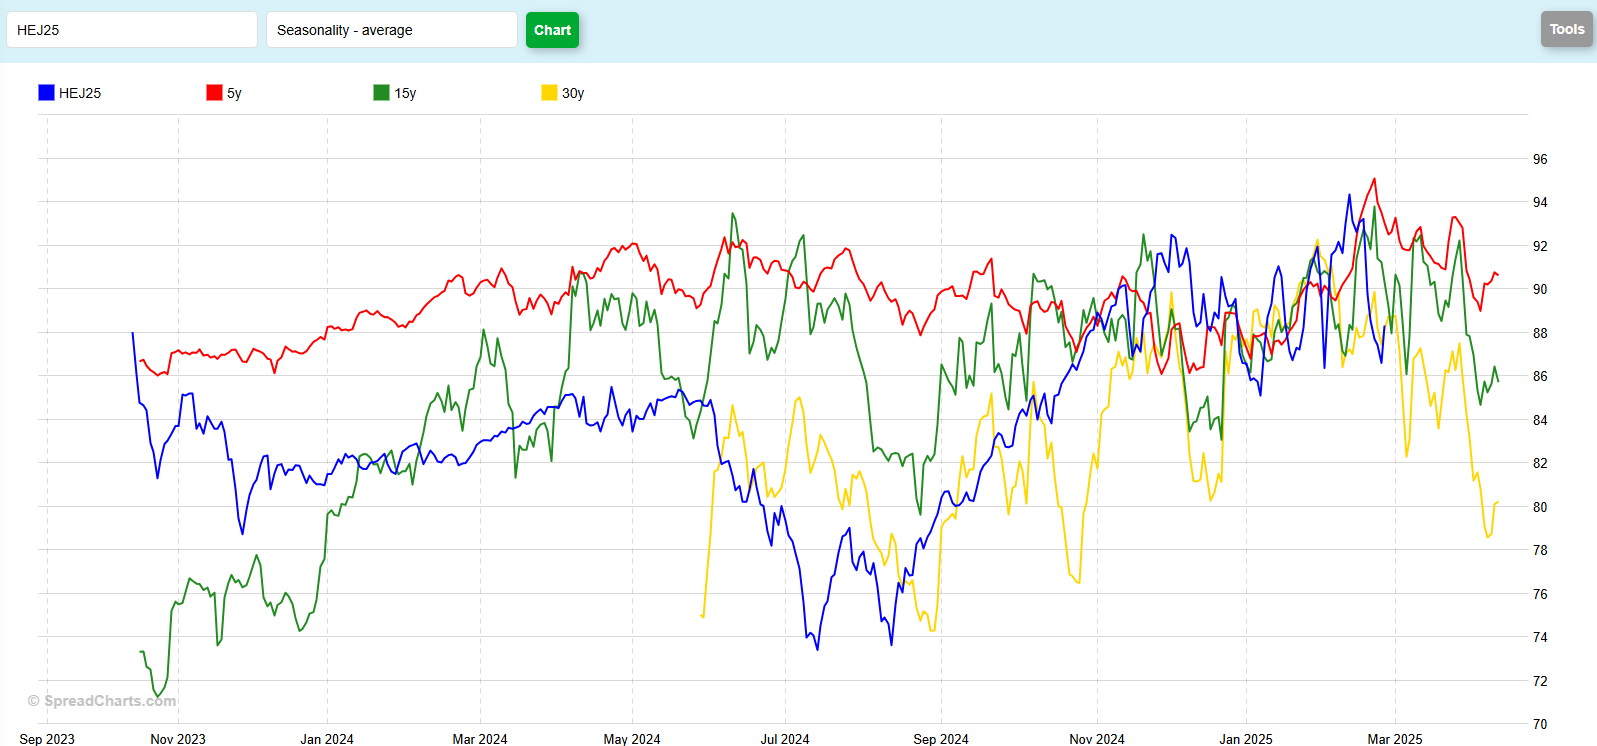
The seasonal chart is a mess, at first glance. But when I look closer at, a few things pop out to me, perhaps you’ll notice them too. First, with the exception of the strong August-December rally, the seasonals patterns track. Yes, the price levels are different, but for the most part, rallies are happening at roughly the “correct” times. Again, with the exception of that rally, the current contract is not diverging, like many of the other commodity markets, to any great effect. The second thing that I see on this chart is that it generally trends lower from now until expiration. The largest declines happen over the longer periods. Thumbnail math indicates a 10.00 decline over the 30-year (yellow), an 8.00 drop over the 15-year (green) and a 7.00 decrease over the 5-year (red) historical pattern into the first week in March. That’s usually been followed by another selloff that generally continues until just a couple of days before expiration. With today’s close, April Hogs have declined 10.325 since the 94.75 high 3 weeks ago. The largest historical drop that is shown on the chart is the decline from the 30-year seasonal peak in January to the low a few days before expiry is 13.68. What do you see?
Jefferson Fosse Walsh Trading
Direct 312 957 8248 Toll Free 800 556 9411
jfosse@walshtrading.com www.walshtrading.com
Walsh Trading, Inc. is registered as a Guaranteed Introducing Broker with the Commodity Futures Trading Commission and an NFA Member.
Futures and options trading involves substantial risk and is not suitable for all investors. Therefore, individuals should carefully consider their financial condition in deciding whether to trade. Option traders should be aware that the exercise of a long option will result in a futures position. The valuation of futures and options may fluctuate, and as a result, clients may lose more than their original investment. The information contained on this site is the opinion of the writer or was obtained from sources cited within the commentary. The impact on market prices due to seasonal or market cycles and current news events may already be reflected in market prices. PAST PERFORMANCE IS NOT NECESSARILY INDICATIVE OF FUTURE RESULTS. All information, communications, publications, and reports, including this specific material, used and distributed by Walsh Trading, Inc. (“WTI”) shall be construed as a solicitation for entering into a derivatives transaction. WTI does not distribute research reports, employ research analysts, or maintain a research department as defined in CFTC Regulation 1.71.