
The information and opinions expressed below are based on my analysis of price behavior and chart activity
April Lean Hogs (Daily)
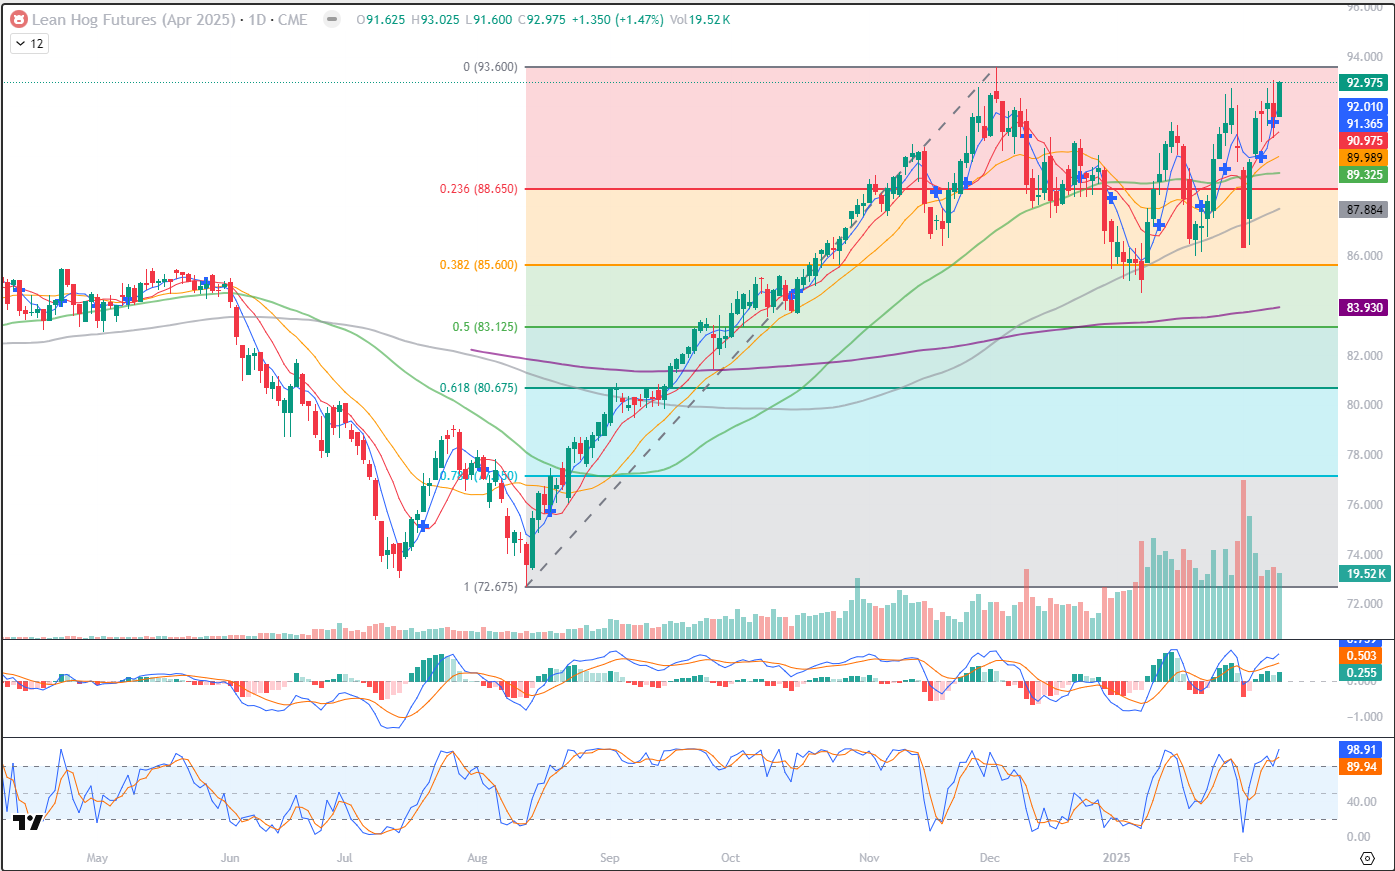
Today, April Lean Hogs settled at 92.975, up 1.35 on the day. This is a contract high close for the Hogs and was a very strong day, with the market opening just 1 tick off the low and closing off the high by 2 ticks. Volume, while not huge, was a respectable 19.5K contracts today. The 5- and 10-day moving averages flipped back to bullish territory yesterday, indicating, perhaps, another push higher. Support may be found near those averages, at 92.01 and 90.975, respectively. The actual crossover number is at 91.365, not a tradeable tick, but it’s displayed on the right side of the chart. The contract high, posted Dec 3rd at 93.600, would seem like a resistance target to me, but given today’s close, it could blow right through there. From there, I would look for resistance at round numbers like 95.00, 96.00, etc. You might notice a few things when looking at the chart above. Following the contract high in December, you’ll see that the market price held at the 38% Fibonacci retracement. Since then, the market has been trading with higher highs and higher lows. Not sure what I mean by that? The low on Feb 3rd was higher than the low of Jan 22nd, which was higher than the low of Jan 8th. Today’s high was higher than the high of Jan 30th, which was higher than the high of Jan 25th. That’s is typically behavior that is associated with a bullish market. The 50-day average is trending up, but more sideways over the past month or so. That’s shown by the green average, at 89.325 today. The 100-day average (grey) has held as support over the past month or so, as well. Stochastics (bottom sub-graph) are bit overbought, but look at the reading between late August and mid-November. The market basically stayed overbought for almost 3 months! Aggressive and well-margined traders may do well to consider long futures positions in Lean Hogs. If options are more appropriate for you, call or email me and we can discuss some strategies.
April Lean Hogs (Weekly)
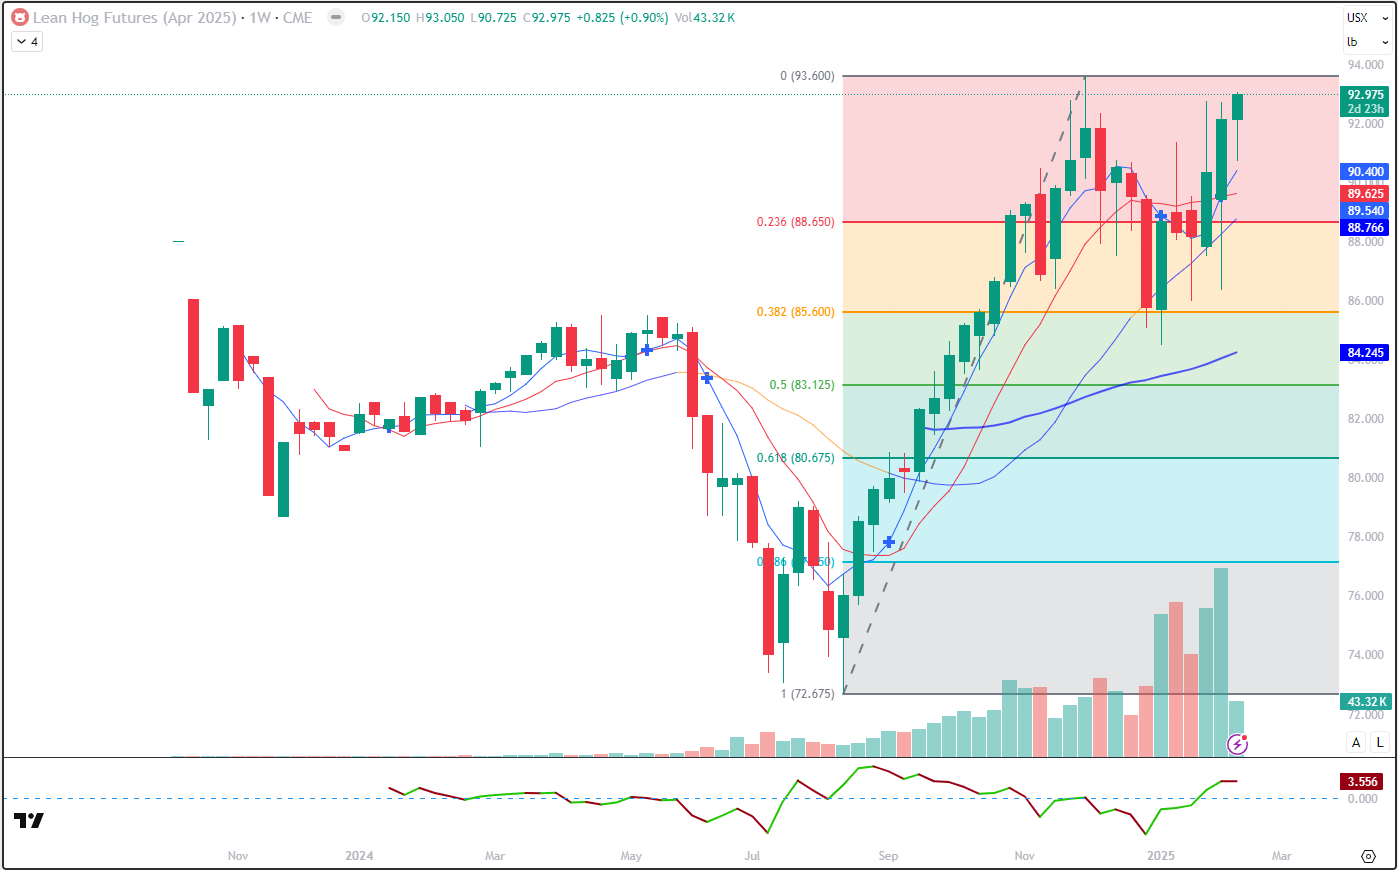
The weekly April Hog chart appears strong to me. The market has had a very strong uptrend that begam with what could be viewed as a “Tweezer Bottom” last July and August. Contract highs were set in the first week of December. The subsequent sell off found support near the 38% retracement and prices have had a good recovery to where we are now. The 5- and 10-week moving averages crossed back into bullish territory last week. It’s difficult to see, but there is a blue cross in last week’s bar at 89.54. Large “wicks” underneath the price bars indicates good buying interest in 5 out the past 7 weeks/bars, and that seems supportive to me. There may be weekly support near 90.40, 89.62 and 88.76, shown in the form of the 5-, 10- and 50-week moving averages. Resistance may be found near the contract high, 93.60 and from there. Perhaps every 1.00 or so higher, like 95.00, 96.00, etc. as I’m a fan of nice, fat round numbers!
April Lean Hogs (Seasonal)
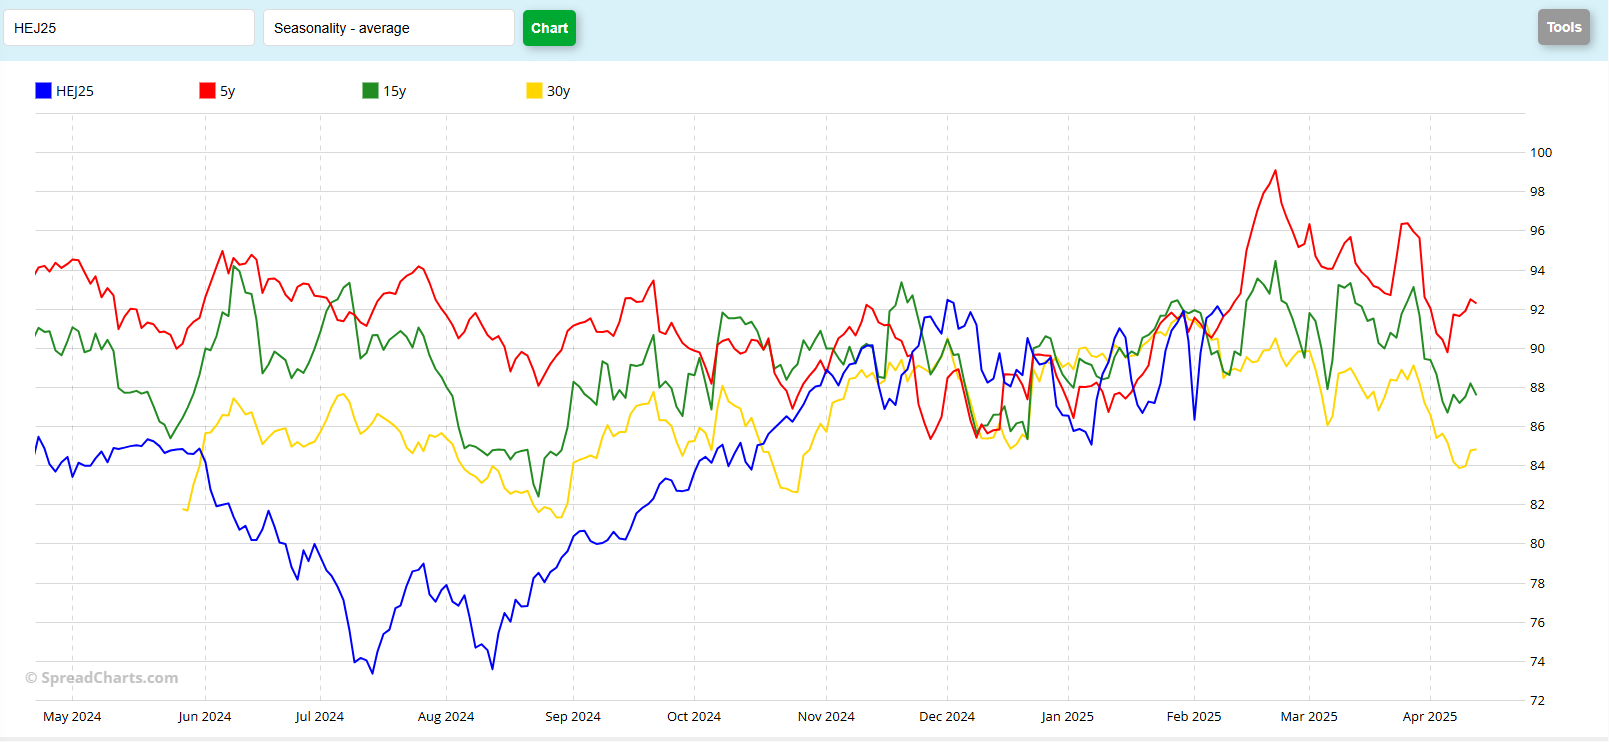
The seasonal chart has some conflicting patterns, I think. The current contract (blue) is within range, if you will, of where prices have been in years past. However, it seems to be “off” by about 2 weeks or so, to my eye. I think you might be able to pick up on that if you start with the low in August. That low came about 10 days “early” when compared to the 5 (red) and 15 (green) year patterns, and about 2 weeks before the 30 (yellow) year pattern. As I look forward, the 5 year suggests a sharp rally that peaks out in another 10 days or so. The 15-year pattern tracks with that, but the historical peak is lower. Following that peak, both of those tend to trend lower until expiration. The 30-year pattern suggests price weakness from now until expiry. Keep in mind that seasonals are suggestions. Yes, most of the commodity market typically follow a seasonal pattern. BUT, they don’t always do the same thing, for the same reasons within the same time frame. We’ve seen many instances where markets are not following along nicely, simply because the fundamental situation has changed. What do you see in this chart?
Jefferson Fosse Walsh Trading
Direct 312 957 8248 Toll Free 800 556 9411
jfosse@walshtrading.com www.walshtrading.com
Walsh Trading, Inc. is registered as a Guaranteed Introducing Broker with the Commodity Futures Trading Commission and an NFA Member.
Futures and options trading involves substantial risk and is not suitable for all investors. Therefore, individuals should carefully consider their financial condition in deciding whether to trade. Option traders should be aware that the exercise of a long option will result in a futures position. The valuation of futures and options may fluctuate, and as a result, clients may lose more than their original investment. The information contained on this site is the opinion of the writer or was obtained from sources cited within the commentary. The impact on market prices due to seasonal or market cycles and current news events may already be reflected in market prices. PAST PERFORMANCE IS NOT NECESSARILY INDICATIVE OF FUTURE RESULTS. All information, communications, publications, and reports, including this specific material, used and distributed by Walsh Trading, Inc. (“WTI”) shall be construed as a solicitation for entering into a derivatives transaction. WTI does not distribute research reports, employ research analysts, or maintain a research department as defined in CFTC Regulation 1.71.