
ZCZ26/ZCH27
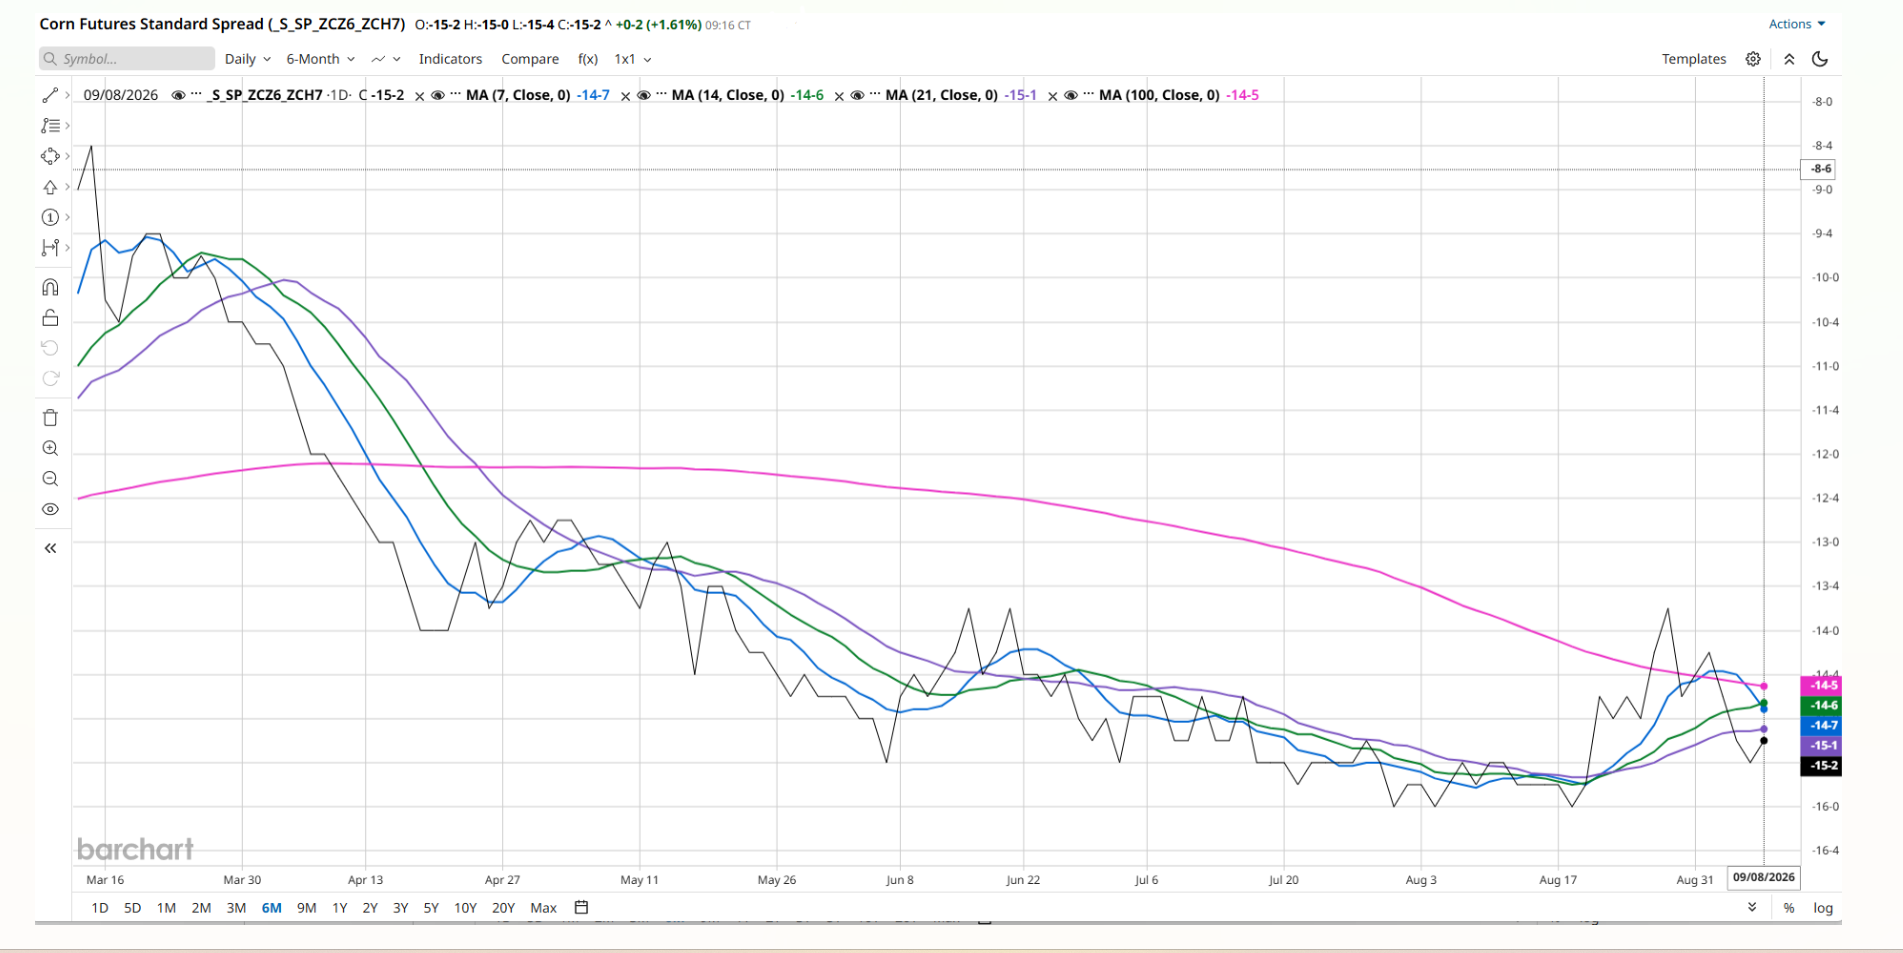
Current Dec 2026 / Mar 2027 (Z26/H27) -15.25¢
| Moving Average | Value |
| 7-day MA | -14.57¢ |
| 14-day MA | -14.70¢ |
| 21-day MA | -15.01¢ |
Intermediate Trend
The spread strengthened noticeably during August:
- Mid-August lows near -16.00¢
- Rally to -13.75¢ on 8/28
- Gain of roughly 2.25¢
That move suggested nearby demand improving relative to deferred futures.
Short-Term Trend
Since the 8/28 high, the spread has weakened:
| Date | Spread |
| 08/28 | -13.75¢ |
| 09/02 | -14.25¢ |
| 09/04 | -15.00¢ |
| 09/08 | -15.25¢ |
This is a clear loss of momentum and a retracement of the late-August strengthening phase.
Current Spread vs. MAs
| Metric | Spread Position |
| vs. 7-day MA | Below by 0.68¢ |
| vs. 14-day MA | Below by 0.55¢ |
| vs. 21-day MA | Below by 0.24¢ |
The fact that the current spread is below all three moving averages is generally bearish for the spread.
MA Alignment
- 7-day MA = -14.57
- 14-day MA = -14.70
- 21-day MA = -15.01
The shorter averages remain above the longer average:
7-day > 14-day > 21-day
However, the spread itself has fallen below all three averages, which often signals:
- The prior bullish trend is losing strength.
- A bearish crossover may develop if weakness continues.
- The market may be transitioning from a strengthening phase into consolidation or renewed weakness.
Bullish
- Recover above the 7-day MA (-14.57¢)
- Then hold above -14.50¢
- A move back toward -14.00¢ to -13.75¢ would re-establish the August uptrend.
Bearish
- Current settlement already below all three MAs.
- Continued closes below -15.25¢ target:
- -15.50¢
- -16.00¢ (August lows)
Bottom Line
The larger trend improved through most of August, but the recent action has turned bearish. The spread is now trading below its 7-, 14-, and 21-day moving averages, indicating that short-term momentum has shifted from strengthening toward weakening. Unless the spread can regain the 7-day MA near -14.57¢, the risk remains for a test of the -15.50¢ to -16.00¢ area.
ZSX26/ZSH27
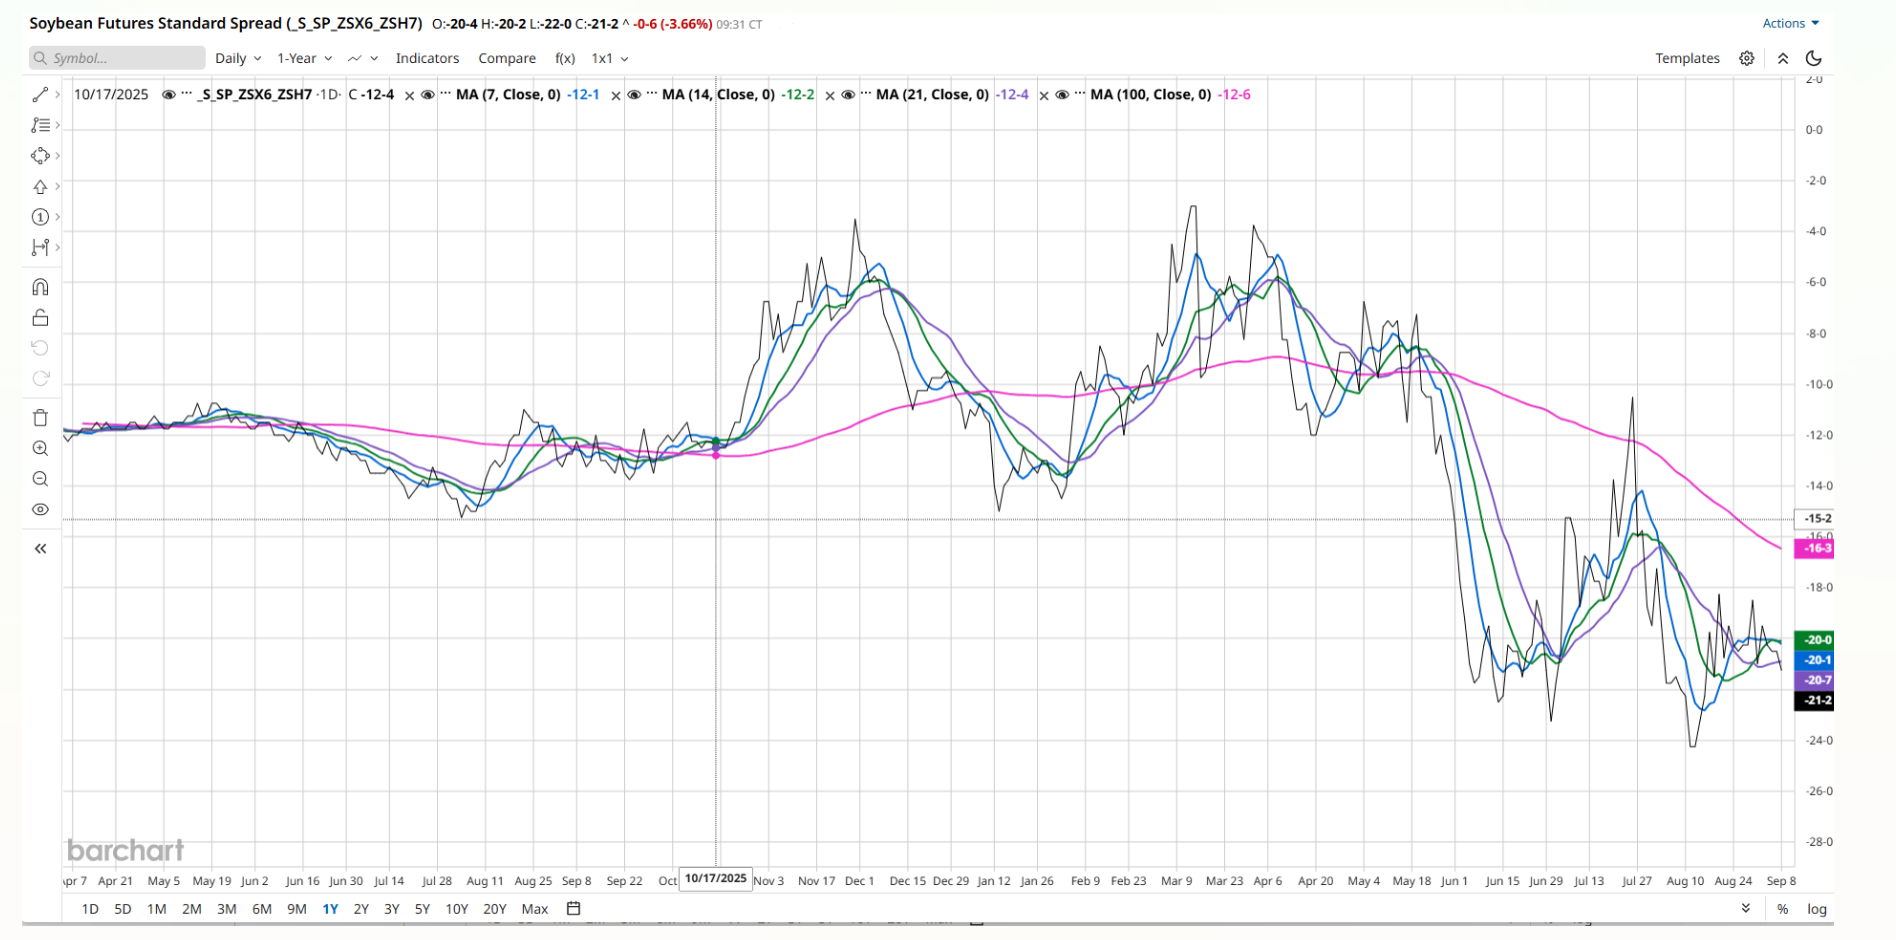
09/04/2026: -20.50¢
Moving Averages
7Day -20.04
14Day -19.95
21 Day -20.76
Trend Analysis
Intermediate Trend (Bullish Spread Action)
The major feature of this chart is the rally from the August lows:
8/13 -24.5
8/20 -18.5
Improvement of 6 cents
That is a substantial strengthening of the Nov26/H27 spread and indicates: Nearby soybean demand improved relative to March, excess carry was reduced and commercials were willing to own nearby beans versus deferred ownership. This was one of the strongest spread rallies in the grain complex during August.
Short-Term Trend is showing loss of momentum.
After reaching the August highs near: -18.25 (8/20 and 8/31 region)
The spread weakened and the market has given back roughly 2¢ of the August rally.
8/31 -18.25
9/01 -20.75
9/04 -20.50
Current Spread vs. Averages
| Comparison | Result |
| Current vs 7-Day | Below by 0.46¢ |
| Current vs 14-Day | Below by 0.55¢ |
| Current vs 21-Day | Above by 0.26¢ |
Current structure:
- 7-day = -20.04
- 14-day = -19.95
- 21-day = -20.76
Notice: 14-Day > 7-Day > 21-Day
This is not a clean bullish stack anymore.
The flattening of the shorter averages indicates:
- August strength is fading.
- Momentum has become neutral-to-bearish.
- However, the spread remains stronger than the longer-term 21-day trend.
What Makes This Different From The Corn Spread?
The Dec26/H27 corn spread is already trading:
- Below the 7-day
- Below the 14-day
- Below the 21-day
which is outright bearish.
The soybean Nov26/H27 spread is:
- Below the 7-day
- Below the 14-day
- Still above the 21-day
That means soybeans are in a corrective pullback, not yet a confirmed bearish trend reversal.
Bullish Triggers
First objective:
- Reclaim -20.00¢ then, move above-19.50. Look to challenge the August highs near -18.25¢ to -18.00¢. A recovery above the 7-day MA would suggest the pullback is ending.
Bearish Triggers
If the spread breaks -21.00¢ next targets become: -21.50¢,-22.25¢,-24.50¢ (August low).
A close under the 21-day MA (-20.76¢) would be the first major bearish signal.
Commercial Carry
August rally reduced carry from roughly -24.5¢ to -18.25¢
- Current correction has only retraced part of that move.
- Carry structure remains notably tighter than it was in mid-August.
This suggests the market is not yet returning to a full harvest-pressure carry structure, although harvest expansion over the next several weeks remains the primary risk.
Neutral to Slightly Bullish
Bullish Factors
- Still above the 21-day MA.
- August uptrend remains largely intact.
- Carry structure much tighter than mid-August.
Bearish Factors
- Trading below the 7-day and 14-day averages.
- Momentum has rolled over since late August.
- Failure to regain -20¢ quickly could invite a retest of -21.5¢ to -22.0¢.
Most important level: -20.75¢ (21-day MA area).
As long as SX26/H27 holds above that zone, the pullback looks corrective. A decisive break below it would shift the outlook from neutral/bullish to outright bearish.
KEZ26/ZWZ26
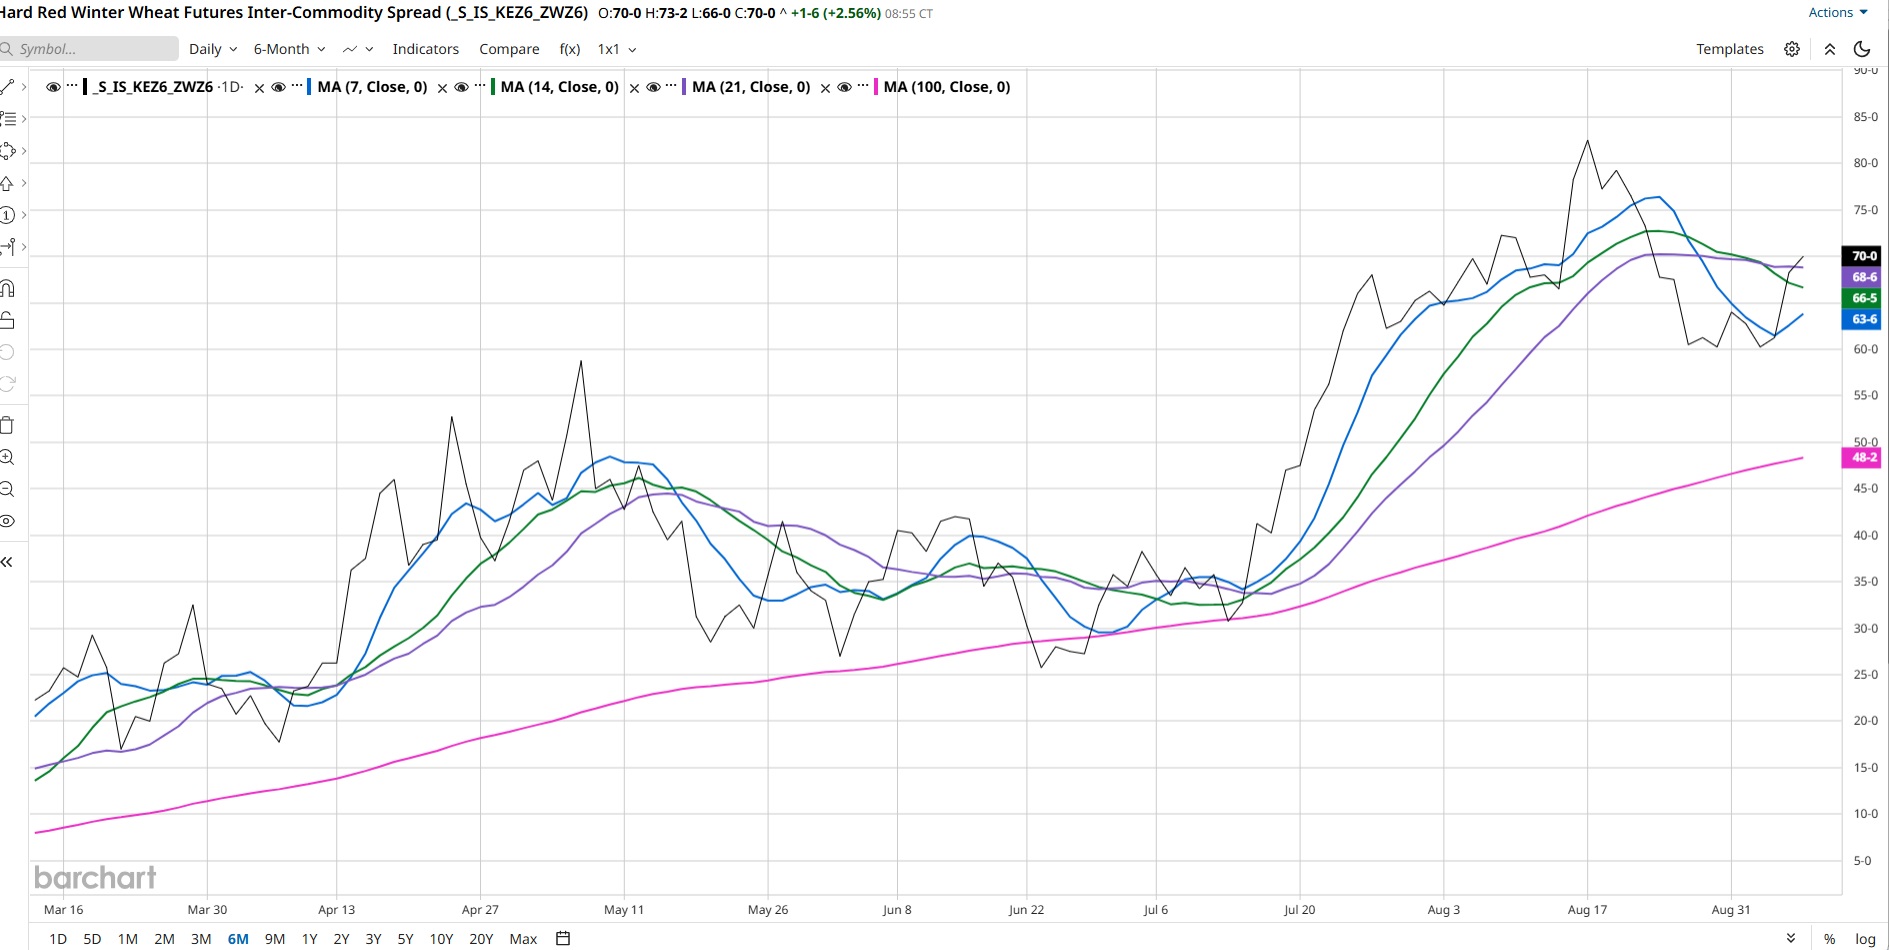
09/08/2026: +70.00¢
This is an inter-market wheat spread measuring KC HRW wheat premium to Chicago SRW wheat.
| Moving Average | Value |
| 7-Day MA | 67.89¢ |
| 14-Day MA | 68.63¢ |
| 21-Day MA | 70.26¢ |
Current Position vs. Moving Averages
| Comparison | Result |
| Current vs 7-Day | +2.11¢ Above |
| Current vs 14-Day | +1.38¢ Above |
| Current vs 21-Day | -0.26¢ Below |
Intermediate-Term Trend
The dominant trend since early August has been a significant weakening of the KC premium:
| Date | Spread |
| 08/18 | 82.25¢ |
| 08/20 | 79.50¢ |
| 08/26 | 66.25¢ |
| 08/31 | 60.00¢ |
The market lost over 22¢ from the August high to the August low.
This suggests that HRW wheat lost relative value versus SRW wheat. The market reduced concern about HRW supply tightness. Commercial demand shifted in favor of Chicago wheat relative to KC.
Recent Trend Reversal: During the past week the spread has recovered sharply:
| Date | Spread |
| 09/03 | 60.50¢ |
| 09/04 | 61.00¢ |
| 09/08 | 70.00¢ |
The spread has gained almost 10¢ in only a few sessions. That is a meaningful bullish reversal.
Moving Average Interpretation
MA Structure
7-Day MA = 67.89
14-Day MA = 68.63
21-Day MA = 70.26
Currently the 14-Day > 7-Day < 21-Day
This is a transitional configuration rather than a strong trend signal. However, the price is above both the 7-day and 14-day averages. The 7-day average is turning higher. Momentum is improving rapidly. The only remaining hurdle is the 21-day average.
Bullish Scenario: A close above 70.25 (21-Day MA) would place the spread above all three moving averages. That would target: 73¢,76¢, 80. The recent 9/8 breakout suggests buyers are attempting exactly this.
Bearish Scenario could be If the spread fails near the 21-day average and turns lower: First supports: 68¢ (14-day MA), 67.9¢ (7-day MA). A break below those averages opens: 64¢, 61¢,60¢
Moderately Bullish factors could be that the current spread is above the 7-day and 14-day MAs. Strong rally from 60¢ to 70¢ during the last week. Also, positive momentum acceleration. Very close to a full bullish MA reclaim.
Some Bearish Factors: Still slightly below the 21-day MA (70.26¢). August trend was decisively lower. Need confirmation above 70-2 to 70-4.
Key Trigger: 70.25¢ to 70.50¢
A sustained move above that zone would confirm the recent rally as a genuine trend reversal and favor a return toward the 75¢ to 80¢ area. A rejection there would argue that the advance is merely a correction within the larger August downtrend.

Walsh Trading, Inc. is registered as a Guaranteed Introducing Broker with the Commodity Futures Trading Commission and an NFA Member.
Futures and options trading involves substantial risk and is not suitable for all investors. Therefore, individuals should carefully consider their financial condition in deciding whether to trade. Option traders should be aware that the exercise of a long option will result in a futures position. The valuation of futures and options may fluctuate, and as a result, clients may lose more than their original investment. The information contained on this site is the opinion of the writer or was obtained from sources cited within the commentary. The impact on market prices due to seasonal or market cycles and current news events may already be reflected in market prices. PAST PERFORMANCE IS NOT NECESSARILY INDICATIVE OF FUTURE RESULTS.
All information, communications, publications, and reports, including this specific material, used and distributed by Walsh Trading, Inc. (“WTI”) shall be construed as a solicitation for entering into a derivatives transaction. WTI does not distribute research reports, employ research analysts, or maintain a research department as defined in CFTC Regulation 1.71.