Bonds and notes ran right into these long term trendline resistance at the highs today. I suggest using these indicators and stay out of the sloppy action in between, the chop. Let’s see if bonds stop up here as inflation heats up.
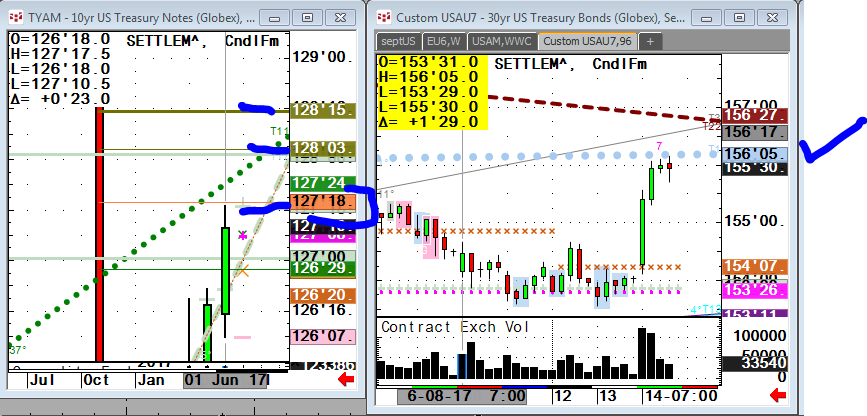
BONDS HIT THE LINES if you have an eye for what matters.
Nat Gas after olive sell in chart now has small olive buy. Under here look out below as nat gas can go cheaper. Trade the big swings, hold winners because they become big winners if you let ride. Under chart 2.92 can hold but like crude, can fail. Levels are good. You just need trader rules to give the color.
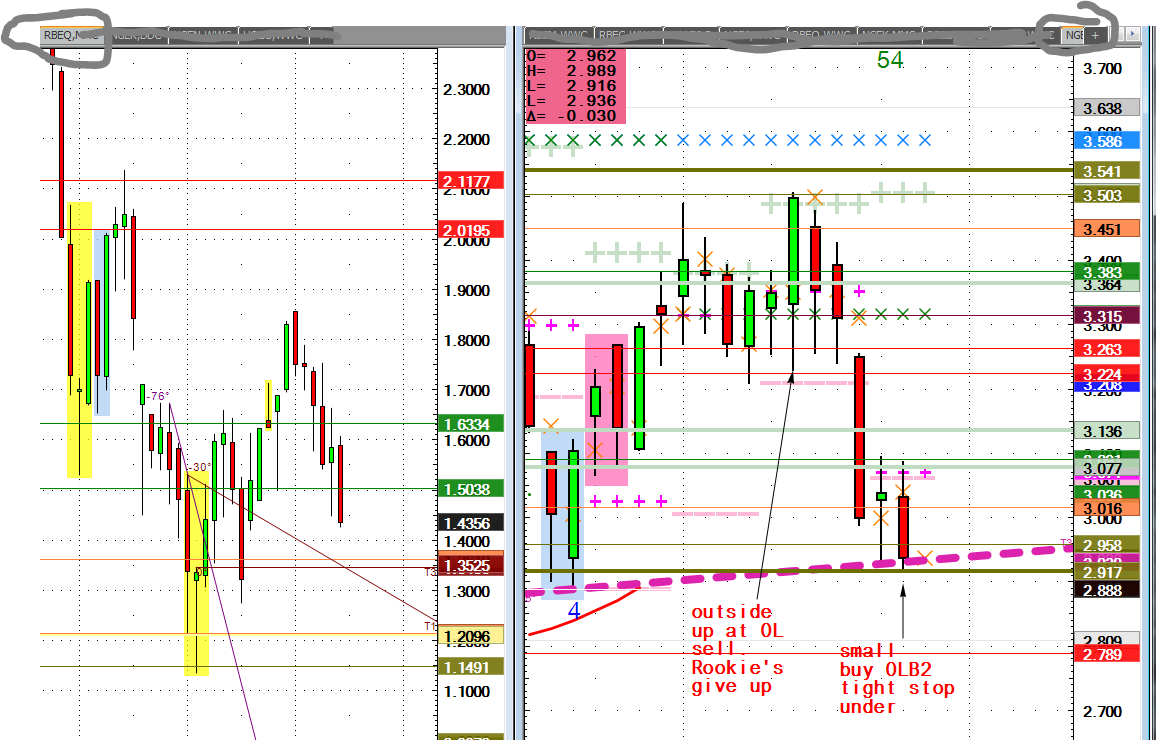
rbob-ngen292-olb
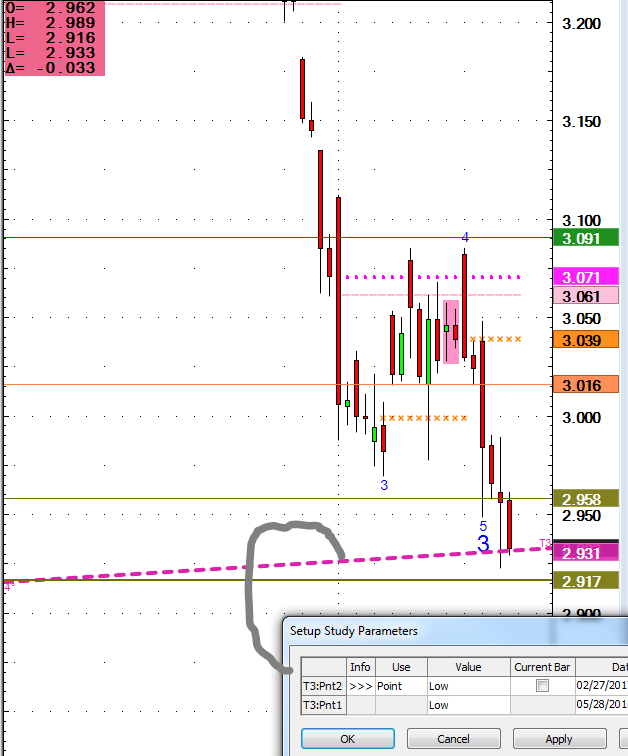
Buy the rumor sell the fact.
Coffee- the waterboarding for longs continues. Olive support is clinging so caution using sell stops will be below is my algo high frequency take.
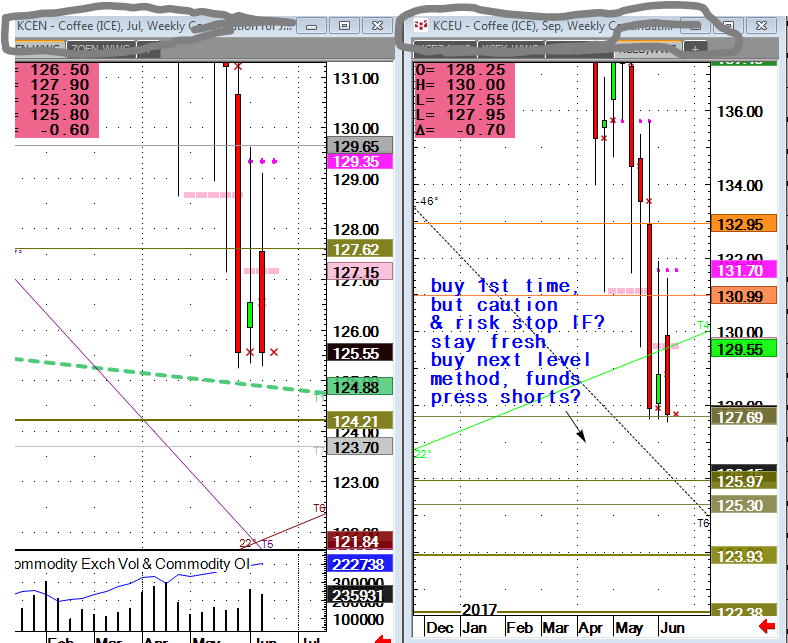
Coffee respects olive lines, 3 weeks now.
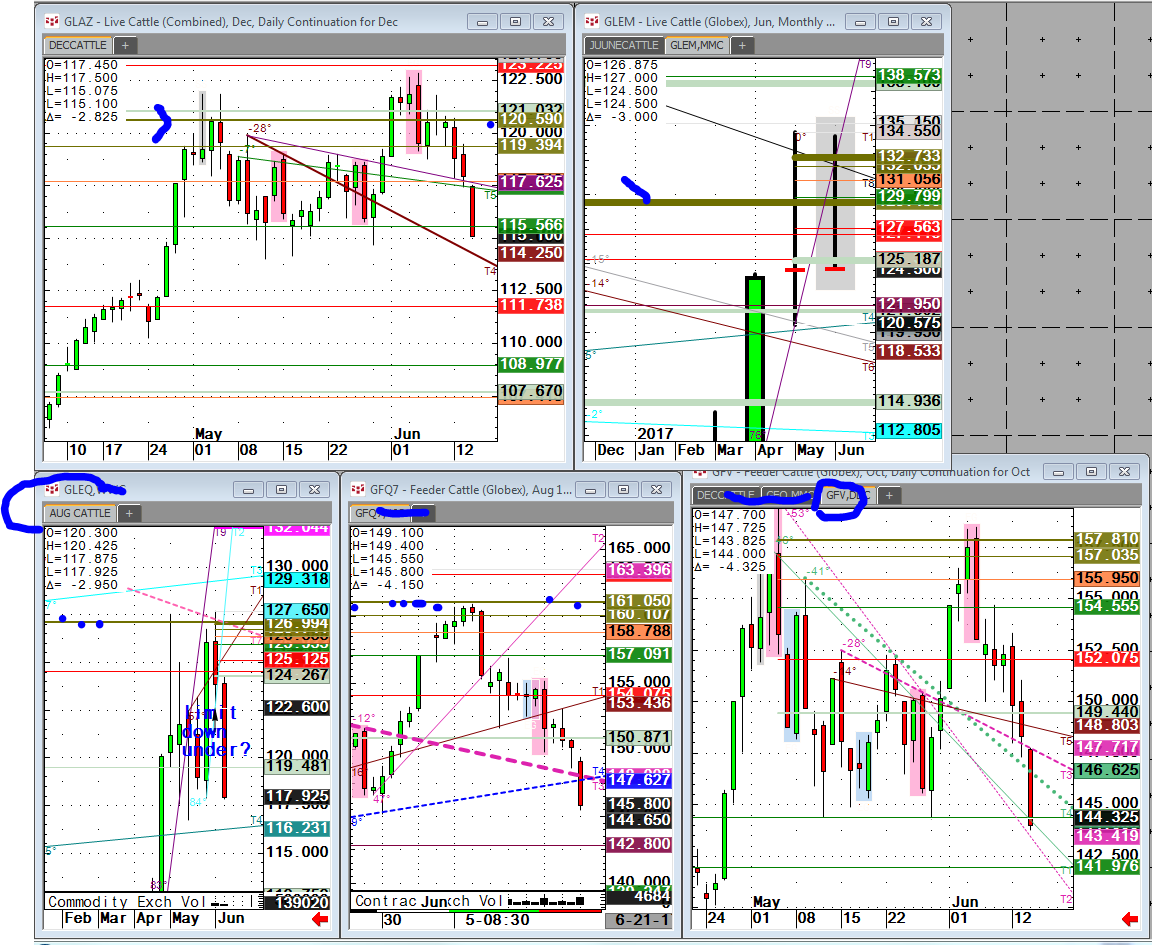 MEATS- These markets are busting loose to downside now well off sell levels cited on walsh since I arrived. If line starts on left of chart meaning is longer term of which one of these was. Sell the olive line when it hits or risk equation is totally different. I study where the trigger is when it is close. It’s the only way for me. This used to stop me out for a decade until this became an obsession for me to have to figure out. Expect the unexpected. Always trade with stops. Why?
Gold-The trendlines speak for themselves and in gold these hashed lines play because the macro funds play when they get triggered.

312.957.8248
