
Commentary:
Longs continue to enter into the Corn market as China continues to make record purchases. Per CFTC data just released, the managed fund long position as of Tuesday January 26th was just over 364K contracts. That was prior to funds in my view pushing the market to new highs in the last three sessions on insatiable demand. On Wednesday 1/27, China purchased 680K metric tons. On Thursday 1/28, they purchased 1.7 million metric tons, while “unknown destinations” purchased 213K, which is likely China. Today, USDA announced that China in two separate purchases bought a massive 2.4 million metric tons. The total for the week was 5.848 million metric tons or 230 million bushels. That is an all time record amount of sales for one week per USDA. On one hand, whatever the reason for the massive purchases at this time, whether the Chinese are short bought or are amassing and increasing their reserves, it may not matter as the trade sees declining ending stocks in both domestic and global carry-outs. We again in my view have more questions than answers now regarding the balance sheet. I think the fact they are chasing this rally and opening the floodgates for imported corn bypassing any hot air from the CCP about maintaining self-sufficiency could be telling. The counter argument here is this and its important for those within the trade to note that we have 769 million bushels of corn that are unshipped as of this week. That is a massive amount. Of the total 462 million bushels are to China while 307 are to “Unknown Destinations.”
The big question for managed longs is why China is making such massive purchases during the second week of the Biden administration even as Beijing ramps up tensions with Taiwan, warning that “Taiwan independence means war.” The Pentagon affirmed support for Taiwan. So are the Chinese buying corn to feed its people or are they playing politics with plans to roll the sales for delivery later? There are precedents for China to buy and then never take shipments, which in my view would play havoc with the balance sheets.. But right now, the bulls are talking about carryover falling at or near 1 billion bu., down from 1.552 billion forecast by USDA on Jan. 12.
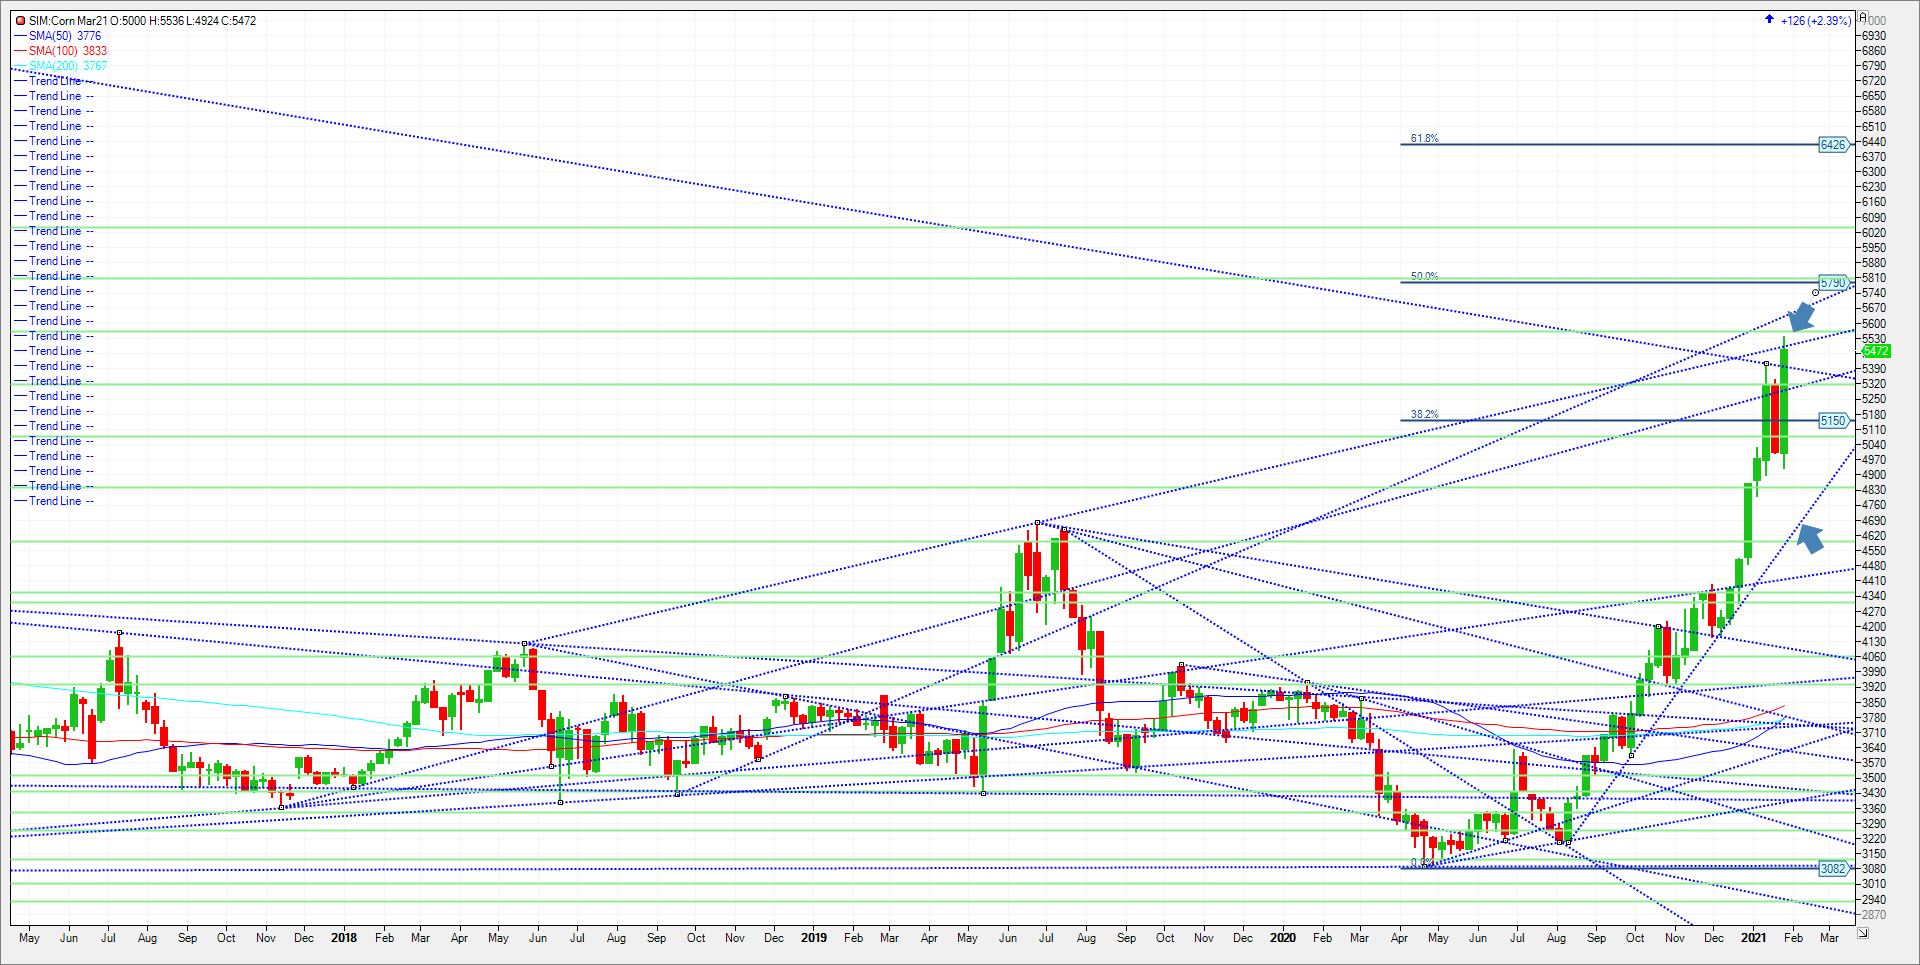
For me it’s all about the charts as for future direction. (See Below).Technical levels for next week (2/1-2/5). Look at the downward blue arrow and the trendline just below it. That level is 550.2. Todays high was 553.6, but we settled just below trendline resistance at 547. A close over is 550.2 is needed in my view to turn higher. The Resistance levels above are 556 (15% higher for year), then 565 trendline above arrow. If we close above that level then the 579/580 are is the next upside target. That level represents 20 percent higher on year and it’s also a 50 percent retracement from the 2012 all-time high (849) to last year’s low at 3.09. Downside levels to watch in my opinion are initial support at 539/540. A close under and its 532. A close under there could push the market to 522, 515 (Fib retracement) and then 5.08 which is 5 percent higher on year. In my view trade the charts.
Please join me for a free grain and livestock webinar every Thursday at 3pm Central. Sign up is free and a recording link will be sent upon signup. We discuss supply, demand, weather, and the charts. Sign Up Now
Walsh Trading, Inc. is registered as a Guaranteed Introducing Broker with the Commodity Futures Trading Commission and an NFA Member.
Futures and options trading involves substantial risk and is not suitable for all investors. Therefore, individuals should carefully consider their financial condition in deciding whether to trade. Option traders should be aware that the exercise of a long option will result in a futures position. The valuation of futures and options may fluctuate, and as a result, clients may lose more than their original investment. The information contained on this site is the opinion of the writer or was obtained from sources cited within the commentary. The impact on market prices due to seasonal or market cycles and current news events may already be reflected in market prices. PAST PERFORMANCE IS NOT NECESSARILY INDICATIVE OF FUTURE RESULTS.
All information, communications, publications, and reports, including this specific material, used and distributed by Walsh Trading, Inc. (“WTI”) shall not be construed as a solicitation for entering into a derivatives transaction. WTI does not distribute research reports, employ research analysts, or maintain a research department as defined in CFTC Regulation 1.71.
Sean Lusk
Vice President Commercial Hedging Division
Walsh Trading
312 957 8103
888 391 7894 toll free
312 256 0109 fax
Walsh Trading
53 W Jackson Suite 750
Chicago, Il 60604