
Commentary
New Crop corn dove 40 cents to the key 5.32 support level on a limit down close yesterday. We briefly dipped to 5.30 last night, but with everything else today, rallied back briefly above weekly trend line resistance at 5.70 this week, to close the day and week out at 566.2. Dec 21 corn lost 40 cents on the week, but we finished with a flurry of buying to finish 36 cents off the weekly low and at a mid-point for the weekly range. Corn today was aided by new crop beans surging 60 cents higher. At one time a 60 cent move in beans was called limit up, but not anymore as bean limits have been raised to 1.50 while corn has moved from 30 cent daily limits to 60 cents. Today’s rally comes on a few fronts. First, we have been down 5 to 6 sessions in a row. Some profit taking may have been in order as overnight rains west of the Mississippi’s failed to materialize highlighting another miss by GFS modeling. Technically the December 21 corn high was 6.28 last week. That level represents 25 percent higher on year for corn. Yesterday’s close was 5.32. that represents 10 percent higher on year. So in a little over a week new crop corn dropped 15 percent. Maybe a little too far too fast, but then again at these levels, I would not be surprised to see this type of volatility continue in the weeks ahead if these forecasts fail to verify and flip flop every few days.
New Crop beans aided Corn’s recovery in my opinion today which tells me that continued dryness in the Western growing areas is a major concern. Crop quality concerns will only become greater if Western Iowa, and the Dakotas remain dry. While Beans aren’t made in June but rather in August we have plenty of time for a recovery for adequate soil moisture to return if weather cooperates. Also of note, per Reuters, “China’s state-owned importers bought at least eight cargos (480,000 MT) of U.S. soybeans, today, two traders familiar with the deal told Reuters. This marked the country’s biggest U.S. bean buys in 4.5-months and comes at a time when the country is typically sourcing the bulk of its bean needs from South America. Traders have signaled deals for as many as 14 cargoes of U.S. soybeans (840,000 MT) are being considered”.If this is verified in the next week or two, it’s a shot in the arm regarding demand at this stage in a supply side driven market.
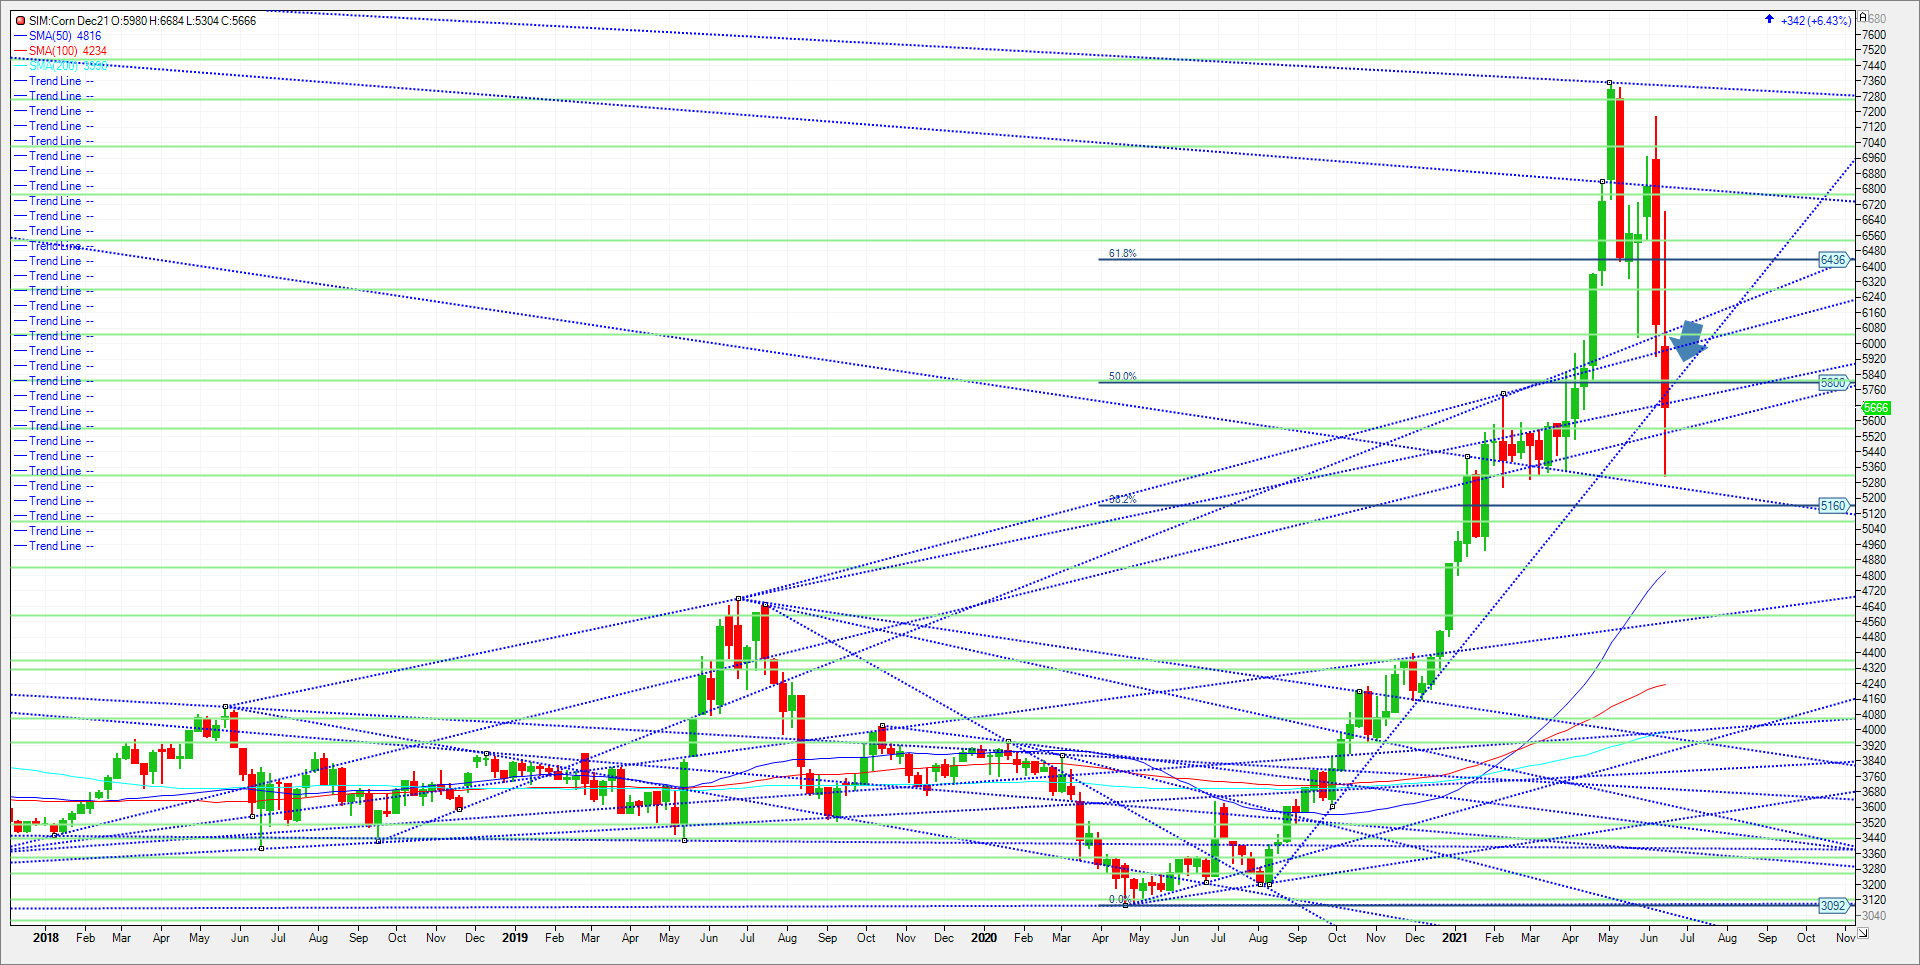
Included here is a December 21 corn futures chart. Notice the steep trend-line highlighted by the Blue Arrow coming up the page from last August’s lows. That line now serves as resistance into next week and beyond as Dec 21 corn is the most actively traded futures contract. Here are some technical in my view that should be watched. Key resistance next week is 5.79 to 5.80. That represents 20 percent higher on year and the key trend line resistance I just referred to, A weekly close over this level and we push to 6.03, and then 6.28. those levels represent 25 and 30 percent higher on year for new crop Corn. Support is seen at 5.56 and then major support at 5.32. That 5.30/5.32 level has to hold or it’s Katy bar the door in my opinion to 5.08 then unchanged on the year at 4.84.
Trade Ideas
Futures-N/A
Options-N/A
Risk/Reward
Futures-N/A
Options-N/A
Please join me each and every Thursday at 3pm Central Time for a free grain and livestock webinar. We discuss supply, demand, weather, and the charts. Sign Up Now
Walsh Trading, Inc. is registered as a Guaranteed Introducing Broker with the Commodity Futures Trading Commission and an NFA Member.
Futures and options trading involves substantial risk and is not suitable for all investors. Therefore, individuals should carefully consider their financial condition in deciding whether to trade. Option traders should be aware that the exercise of a long option will result in a futures position. The valuation of futures and options may fluctuate, and as a result, clients may lose more than their original investment. The information contained on this site is the opinion of the writer or was obtained from sources cited within the commentary. The impact on market prices due to seasonal or market cycles and current news events may already be reflected in market prices. PAST PERFORMANCE IS NOT NECESSARILY INDICATIVE OF FUTURE RESULTS.
All information, communications, publications, and reports, including this specific material, used and distributed by Walsh Trading, Inc. (“WTI”) shall not be construed as a solicitation for entering into a derivatives transaction. WTI does not distribute research reports, employ research analysts, or maintain a research department as defined in CFTC Regulation 1.71.
Sean Lusk
Vice President Commercial Hedging Division
Walsh Trading
312 957 8103
888 391 7894 toll free
312 256 0109 fax
Walsh Trading
53 W Jackson Suite 750
Chicago, Il 60604