
Commentary
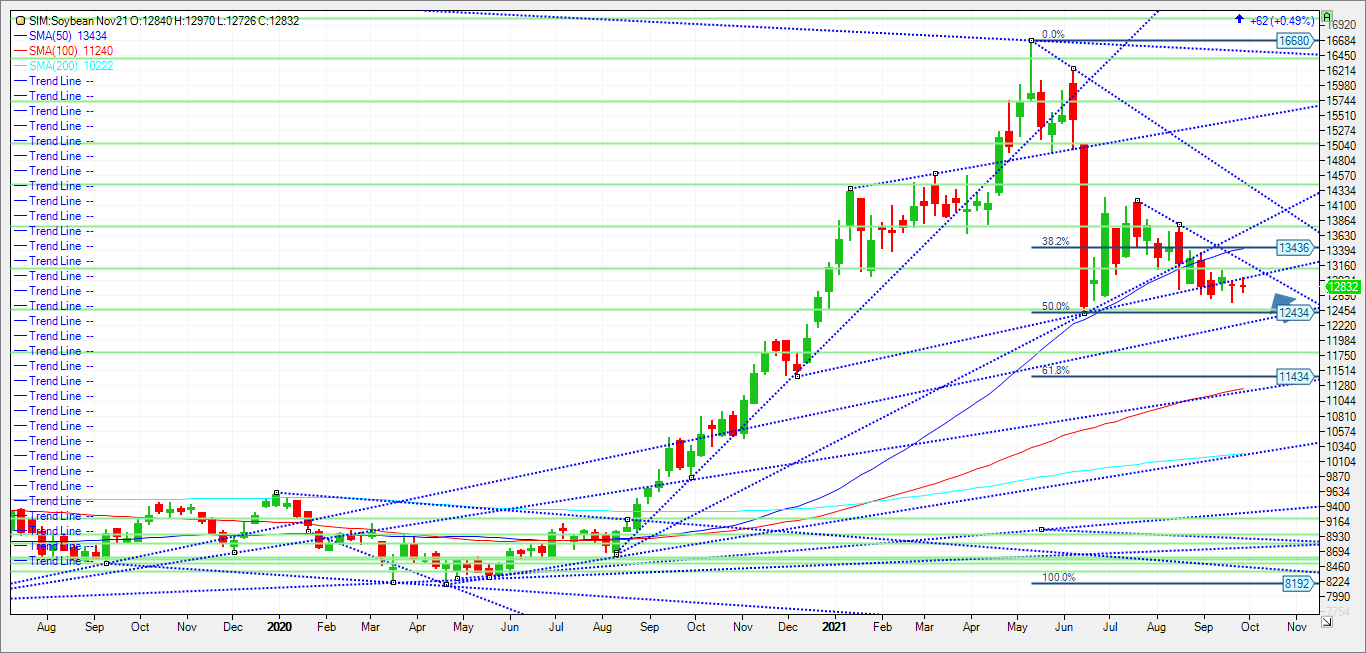
Tomorrows 11 am on farm stocks report is expected to show U.S. soybean stockpiles as of Sept. 1 expected to shrink to 174 million bu., per Reuters surveying a number of analysts. That figure would be down 67% from the same date in 2020 and the smallest Sept. 1 soy stocks figure since 2014. Like corn the low on farm estimates have been priced into the market in my view. But unlike corn, beans have less wiggle room regarding ending stocks and stocks to usage. Yields out of the field have been variable so far but so far seem to be leaning to much better than expected in my view. USDA will update this in their next supply and demand report on October 12th, provided that the gov’t is still open and funded at that point. Managed Money in beans are approximately long 56 K bean contracts, while short 19 K in meal and long 45 K in soy oil. We have seen a lot of pairing or liquidation in beans and oil by funds while they sit net negative in meal. Conversely they are long 225 K contracts in corn. Three days into the week and the soybean market is down a penny. Outside of a report day surprise tomorrow, I look for the market to grind lower as we get deeper into harvest. Under normal circumstances, the rule of thumb is that the market won’t see a harvest low until harvest is 35 to 40 percent complete in my opinion. That said, we are not in normal times. Oats sit 50 cents higher than Corn almost pushing 6.00, Bean Oil has a 5 handle, and Minneapolis wheat sits above 9.00. I think we are setting up for a wild 4th quarter and the tight ranges seen recently in corn and beans are going to be violated in my opinion. I included a weekly continuous soybean chart. Trend-line resistance into next week at 12.99. A close over and its 1315. A close over that level in my view may push the market to 1343 and then 1376. Minor support is the this weeks low at 1272, but if we get a settle under , I think the market could test last weeks low at 1257. Underneath that and it’s the June lows to be tested at 1240.1245 area. 1245 is 5 percent down for the year, while 1243 is a 50 percent retracement from this years high to last years low. A close under this area and the next level of support is 1228 in my view.
Trade Ideas
Futures-N/A
Options-N/A
Risk/Reward
Futures-N/A
Options-N/A
Please join me for a free grain and livestock webinar every Thursday at 3pm Central. We discuss supply, demand, weather and the charts. Sign Up Now
Walsh Trading, Inc. is registered as a Guaranteed Introducing Broker with the Commodity Futures Trading Commission and an NFA Member.
Futures and options trading involves substantial risk and is not suitable for all investors. Therefore, individuals should carefully consider their financial condition in deciding whether to trade. Option traders should be aware that the exercise of a long option will result in a futures position. The valuation of futures and options may fluctuate, and as a result, clients may lose more than their original investment. The information contained on this site is the opinion of the writer or was obtained from sources cited within the commentary. The impact on market prices due to seasonal or market cycles and current news events may already be reflected in market prices. PAST PERFORMANCE IS NOT NECESSARILY INDICATIVE OF FUTURE RESULTS.
All information, communications, publications, and reports, including this specific material, used and distributed by Walsh Trading, Inc. (“WTI”) shall not be construed as a solicitation for entering into a derivatives transaction. WTI does not distribute research reports, employ research analysts, or maintain a research department as defined in CFTC Regulation 1.71.
Sean Lusk
Vice President Commercial Hedging Division
Walsh Trading
312 957 8103
888 391 7894 toll free
312 256 0109 fax
Walsh Trading
53 W Jackson Suite 750
Chicago, Il 60604