Below is a snapshot of open trade positions in the Absolute Momentum Strategy investment.
The total open trade equity in the portfolio inclusive of fees and commissions as of the close of trading on Friday, January 27th, 2017 = $1,1293.50
LAST WEEK IN TRADING
Long Term Trend Following
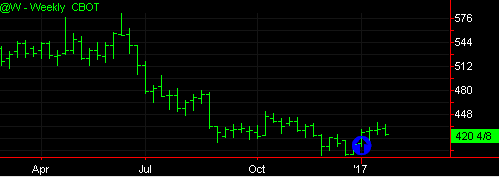
Long March Wheat was entered at 421 3/4 on 1/5/17. Net Profit/ Loss is -$91.50 at the close of trading Friday, January 27th, 2017.
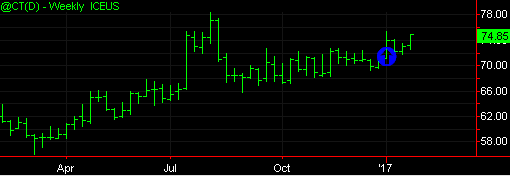
Long March Cotton was entered at 72.93 on 1/4/2017. Net Profit/Loss is $931 at the close of trading Friday, January 27th, 2017.
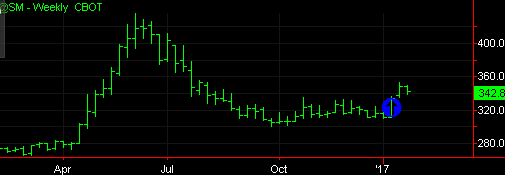
Long March Soymeal was entered at 335 on 1/13/2017. Net Profit/ Loss is $771 at the close of trading Friday, January 27th, 2017.
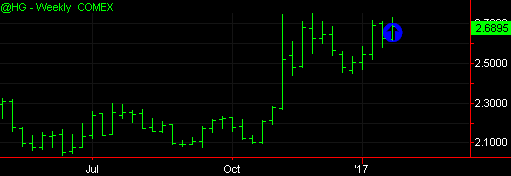
Long March Copper was entered at 2.72 on 1/25/2017. Net Profit/ Loss is -$791.50 at the close of trading Friday, January 27th, 2017.
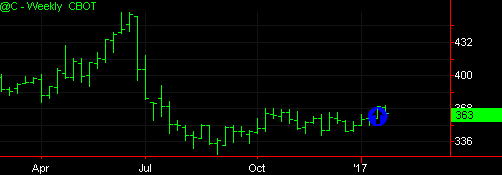
Long March Corn was entered at 3.68 1/2 on 1/20/2017. Net Profit/ Loss is -$329 at the close of trading Friday, January 27th, 2017.
Long February Lean Hogs was entered at 67.00 on 1/25/2017 then rolled to the April contract at 67.575 on 1/27/2017. Net Profit/ Loss is -$147 at the close of trading Friday, January 27th, 2017.
CURRENCY PROGRAM POSITIONS
(shown in daily bars)
Long March Swiss Franc was entered at 0.9951 on 1/12/2017. Net Profit/ Loss is $1008.50 at the close of trading Friday, January 27th, 2017.
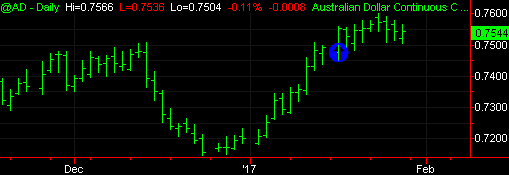
Long March Australian Dollar was entered at 0.7509 on 1/17/2017. Net Profit/ Loss is $321 at the close of trading Friday, January 27th, 2017.
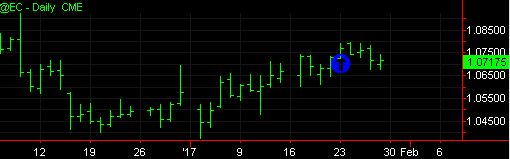
Long March Euro Currency was entered at 1.07455 on 1/23/2017. Net Profit/ Loss is -$379 at the close of trading Friday, January 27th, 2017.
Absolute Momentum Strategy
Nominal Investment Level $150,000
Minimum Investment Level $75,000
Last Month 17.75%
YTD ROR 17.64%
Total Return 35.14%
Performance Compiled By Turnkey Trading Partners
*Figures based on a $150,000 investment level
There is a substantial risk of loss in trading futures. Past performance is not indicative of future results.
*Returns are based on proforma adjustments to Mr. Reavis’ accounts to reflect fees through 11/2015. Client accounts will be traded in like fashion 12/2015 going forward.
Strategy Description:
This investment systematically trades trends in 21 commodity markets, in 6 sectors of the economy, and in 3 time frames. The portfolio is composed of a long-term basket of commodities, a medium-term basket of currencies, and a day-trading equity index strategy. A day-trading program holds no over-night positions therefore it’s results are not shown here.
These are the commodities that are traded in the Portfolio: S&P mini, Russell mini, Corn, Wheat, Soybean, Soymeal, Lean Hogs, Crude Oil, Natural Gas, Sugar, Coffee, Cotton, Japanese Yen, Euro, Swiss Franc, Australian Dollar, 10 Year Note, 30 Year Bond, Gold, Silver, and Copper.
BarclayHedge Awards