
The information and opinions expressed below are based on my analysis of price behavior and chart activity
November Soybeans (Daily)
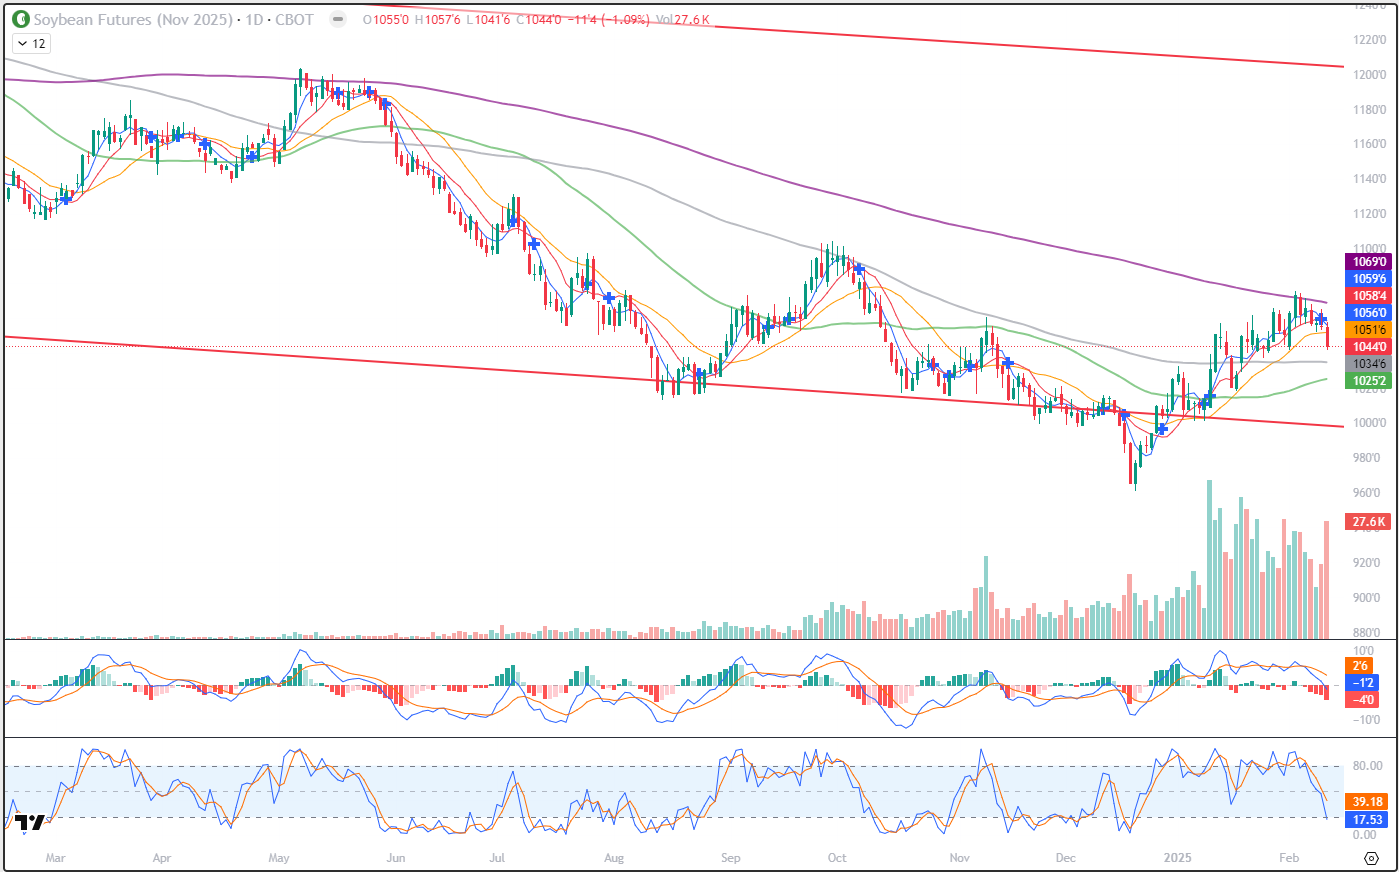
November Soybeans closed down 11 ½ cents on Monday, settling at 10.44. Last week prices tested the 200-day moving average (purple line, roughly 10.72 last week, 10.69 today) and have since pulled back some. The 5- and 10-day moving averages flipped to the bearish side yesterday, denoted by the blue cross within yesterday’s bar. Tuesday was also a Doji, a day of price equilibrium, which saw the open and close almost at the same price. Usually, but not always, days (or bars) like that are signs of market indecision. Often, I find it effective to look for the next directional close, outside of the Doji’s range, to establish the next directional move. Today’s close was one of those days, and the settlement below Tuesday’s range seems bearish to my eye. The 5- (blue), 10- (red) day moving averages are above the market now, offering potential resistance at 10.59 ¼ and 10.58 ½, respectively. I think the prospect of better weather in South America, conducive to an acceleration of harvest, and a very large harvest at that, are looming overhead. Volume today (bottom of the price chart) was higher than it has been since New Year’s Eve. High volume on a strong directional move typically means more of that, in my experience. Support may appear near the 100-day average (grey) at 10.34 ¾ today, or the 50-day average (green) at 10.25 ¼ today. Producers are likely not happy that prices are also below the 19-day average (orange, 10.51 ¼ today) which will equate with the February insurance price at the end of the month. To be clear about that, 10.51 ¾ is NOT the insurance price. The average of closes during February WILL be the insurance price, and we have to wait until the close on the 28th to get that number. I’ve included it on my charts for this month just so we can see it. It’s early in the year to put hedges on, but I do think that Soybean producers should have some protection at this point. Put Options are a good way to go, but be sure to consider the “delta” of the options when deciding which ones to use. November Puts are expensive right now, a 10.40 Put just 4 cents out of the money, is priced at 57 ¾ cents today, or $2,887.50 before commissions and fees. Producers looking to put on protection may do well to consider Put Spreads, as they will reduce your out-of-pocket cost. Personally, I think it might be wise to have 25% of your intended production protected. Reach out if you need some discussion about what might be appropriate for you and your operation. While I don’t think many people are speculating in the November contract, aggressive and well-margined traders may do well to consider short positions, with an eye toward a risk and reverse level above Tuesday’s high of 10.65 ½.
November Soybeans (weekly)
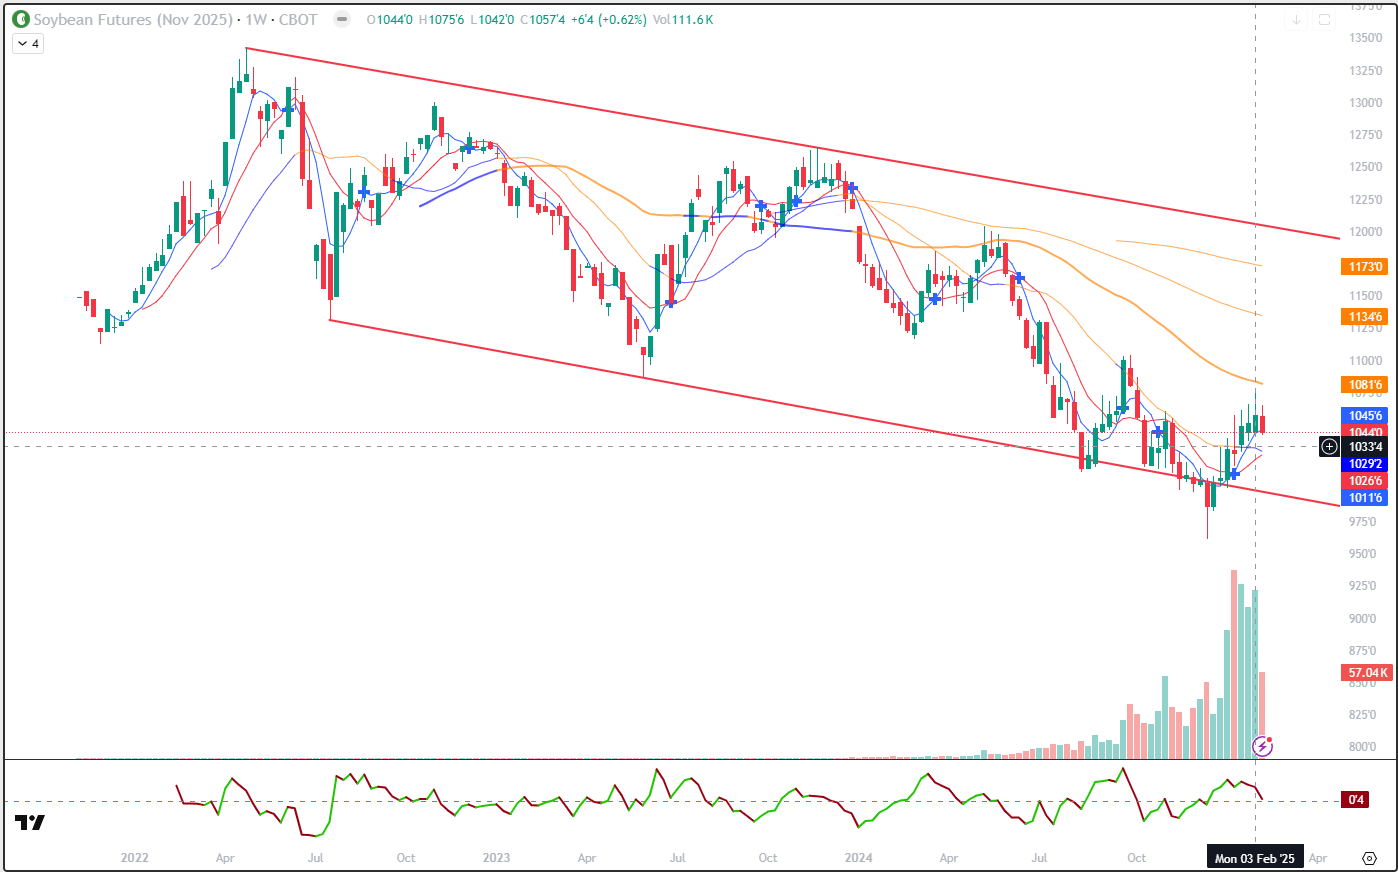
If you look at the chart above, you may notice that we’ve been in a downtrend almost as far back as the chart goes. The red trendlines are drawn off the highs in Aprill 2022-Nov 2023 and lows of July 2022-Mat 2023. The market has been making lower lows and lower highs pretty consistently, with the February 2024 lows being an exception. Currently, we are much closer to the bottom end of the range than the top. The last 4 weeks (bars, not including the current week) all have tall wicks, which usually indicates more selling pressure. Today’s close was just below the 5-week average (blue, 10.45 ¾ today) but still above the 10-week average (red, 10.26 ¾ today) Located between those, on the chart, is the 50-week average (blue, recently switched from orange) which is at 10.29 ¼ today. You may notice the declination of that average change to down, so far this week. The 100-week average is up at 10.81 ¾ today and still declining. Above that are the 150-week and 200-week at 11.34 ¾ and 11.73, respectively. With the South American harvest progressing, I think it’s difficult to be very bullish Soybeans right now. Our window for exports is closing quickly. Yesterday’s WASDE report showed no change for the US crop numbers, not surprisingly, as the February WASDE usually doesn’t see much change there. World production was lowered from January to February to 420.76 million metric tons, but that’s still a large increase from the 23-24 world production numbers which were 394.37 mmt. For me, it’s difficult to see what would be bullish about new crop Beans, given the larger world production. Add in the tariff happiness/misery and what do you see happening?
November Soybeans (Seasonal)
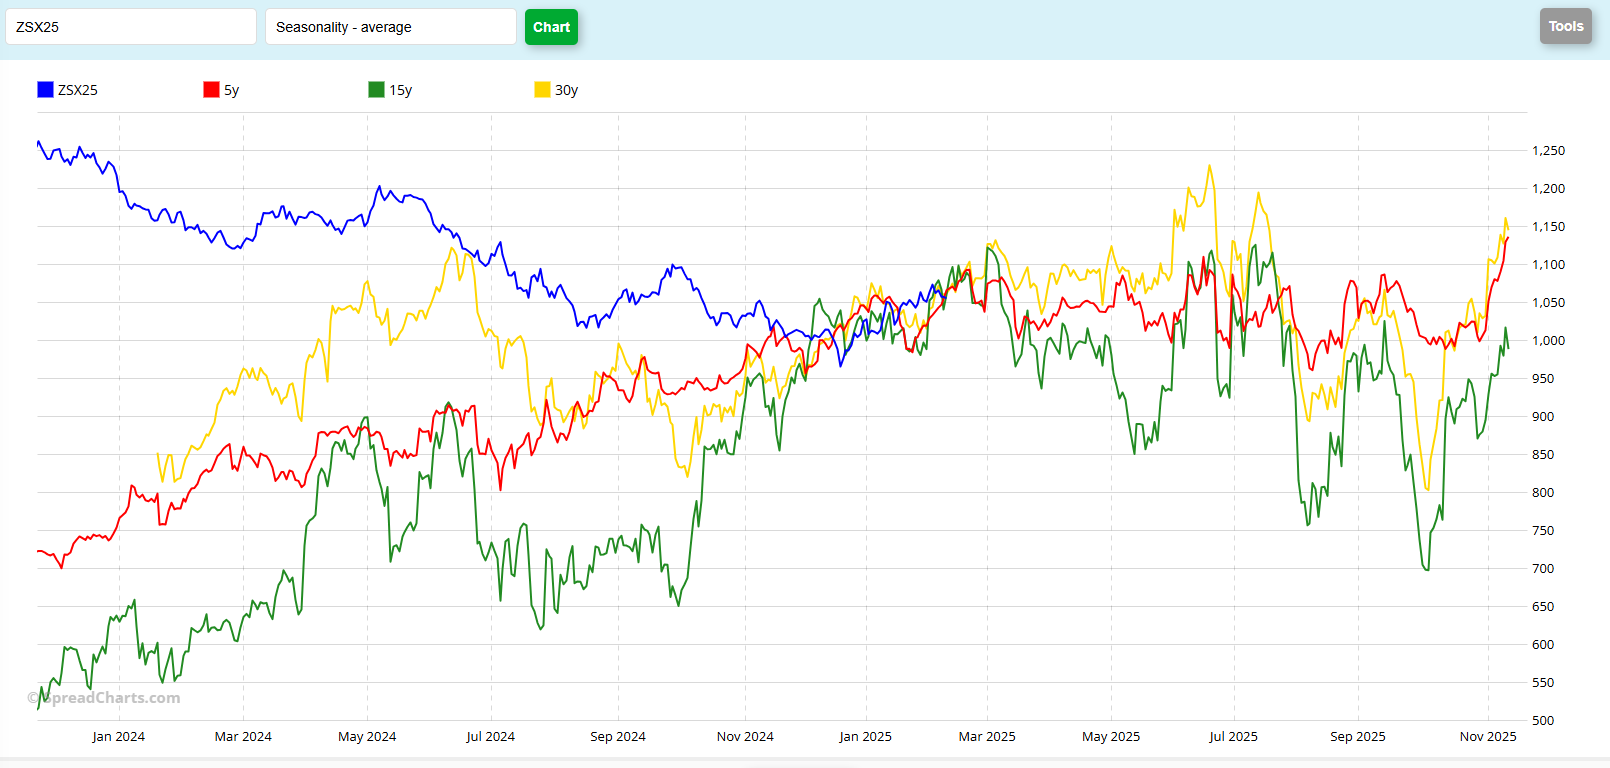
The seasonal chart for Nov Beans is interesting, but perhaps not very helpful at this point in time. The current Nov contract has been out of line with the seasonal patterns for most of it’s life. An argument can be made that they’ve been in line since mid-December, but I think that’s more coincidental than anything else. You might notice that the blue line has been trending lower until that low was made in Dec. Looking forward, this chart is a mess, to my eye. I do see somewhat similar patterns between the 5- (red) 15-(green) and 30-year (yellow) historical data. For example. the highs being set just after Father’s Day, followed by another lower peak in July, to point out just one that I see. But price levels are very different, as the past several years have been an odd outlier in pricing, due to COVID, foreign demand, market irrationality, etc. The biggest clue that I can take from this chart right now, it that there is likely more price volatility ahead. We may see 2025 be a good year for trading in and out of hedges to try and maximize the potential, as opposed to “set it and forget it.”
Jefferson Fosse Walsh Trading
Direct 312 957 8248 Toll Free 800 556 9411
jfosse@walshtrading.com www.walshtrading.com
Walsh Trading, Inc. is registered as a Guaranteed Introducing Broker with the Commodity Futures Trading Commission and an NFA Member.
Futures and options trading involves substantial risk and is not suitable for all investors. Therefore, individuals should carefully consider their financial condition in deciding whether to trade. Option traders should be aware that the exercise of a long option will result in a futures position. The valuation of futures and options may fluctuate, and as a result, clients may lose more than their original investment. The information contained on this site is the opinion of the writer or was obtained from sources cited within the commentary. The impact on market prices due to seasonal or market cycles and current news events may already be reflected in market prices. PAST PERFORMANCE IS NOT NECESSARILY INDICATIVE OF FUTURE RESULTS. All information, communications, publications, and reports, including this specific material, used and distributed by Walsh Trading, Inc. (“WTI”) shall be construed as a solicitation for entering into a derivatives transaction. WTI does not distribute research reports, employ research analysts, or maintain a research department as defined in CFTC Regulation 1.71.