
The information and opinions expressed below are based on my analysis of price behavior and chart activity
May Wheat (Daily)
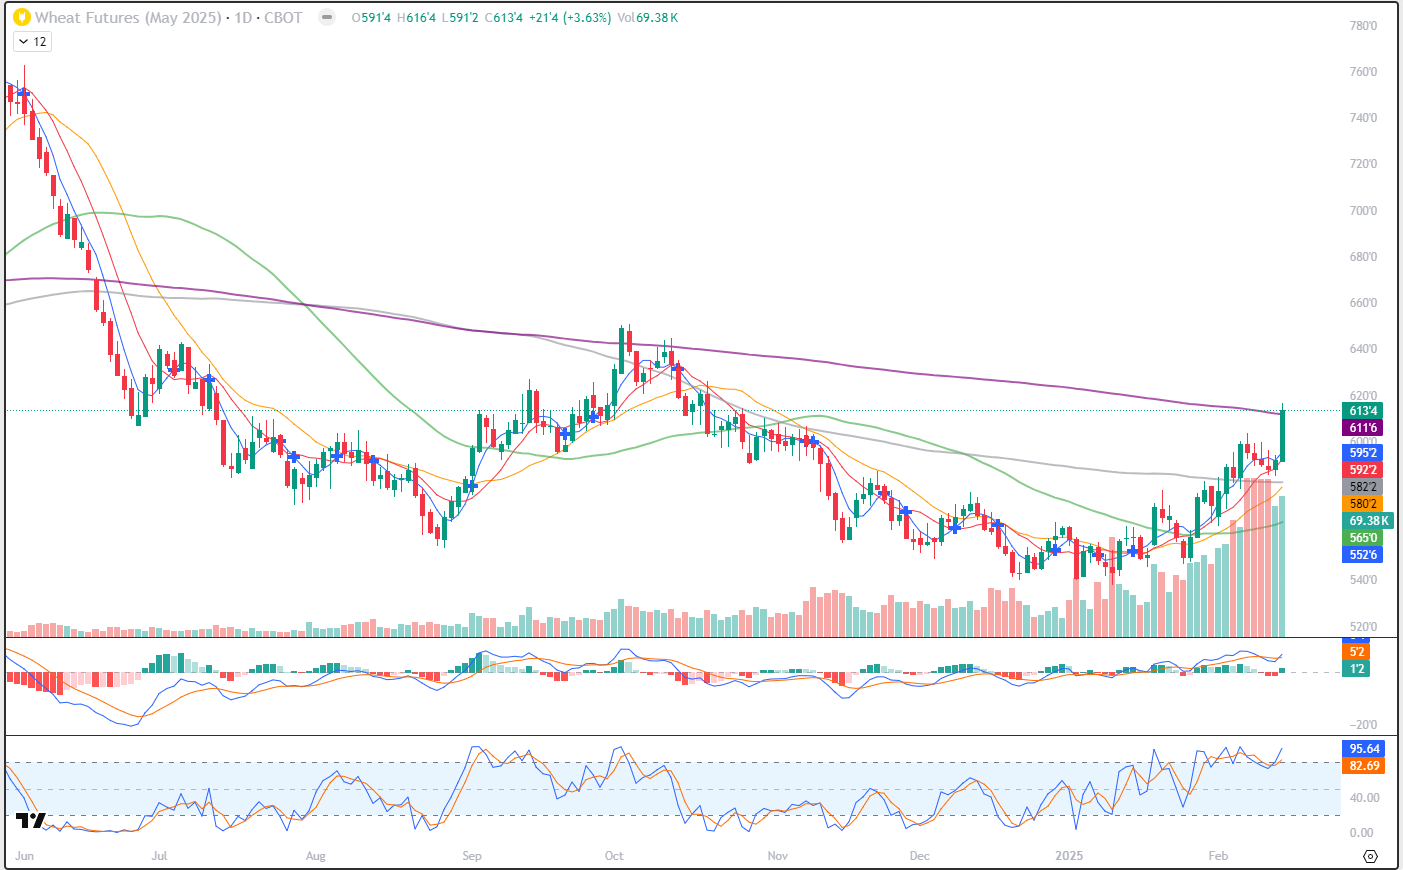
May Wheat (Chicago) closed up 21 ½ cents on Friday, settling at 6.13 ¼, the highest close since October 17th of last year. Volume over the past 6 sessions has been high as traders roll from the March to the May. But the high volume did not equate to much pressure on prices. Yes, the market was lower Friday-Wednesday, but you might notice that those 4 days of pressure did not break out of last Thursday’s range and prices have held support at the 10-day moving average. In fact, with the exception of just 2 days, that moving average has offered support for the past month. Today’s settlement pushed Wheat above the 200-day average for the first time since October of last year. However, that was the only day, until today, that Wheat was able to stay above that level. Stochastics (bottom sub-graph) are in overbought territory, but not currently showing any signs of weakness. The overbought condition has been here for the past month, as well. The MACD indicator, just above the Stochastic, hooked higher today. Daily support might be found near last week’s high of 6.03 ½ and then to the nice, fat, round number of 6.00. The 5- and 10-day averages are at 5.95 ¼ and 5.92 ¼, respectively. The 100-day average is at 5.82 ¼ and the 50-day is all the way down near 5.65. The 50 seems to have turned higher, while the 100 has not yet. The 23% Fibonacci retracement (from May ’24 highs to Jan ,25 lows) is not pictured, but that level is at 5.96, also another potential support level. Overhead resistance might be located near the 38% retracement (also not pictured) at 6.29 ½ and then up to 6.50 ¾, which was the October 3rd high. To my eye, this market looks bullish.
Aggressive and well-margined traders may do well to consider long positions. Less aggressive traders may do well to consider Call Options and Call Spreads. Producers should keep an eye here, looking for places to begin hedging your intended 2025 production. I would NOT recommend being fully hedged yet, as I believe that prices will keep going higher due to weather here in the US and demand from around the world. At this time, I do not expect prices to get back up to the 7.70+ area like we saw last spring, but that may change as time moves forward, depending on the supply/demand and weather fundamentals. If we see some sort of geopolitical nonsense, that could also change the picture, similar to the way it did just a few short years ago.
May Wheat (Weekly)
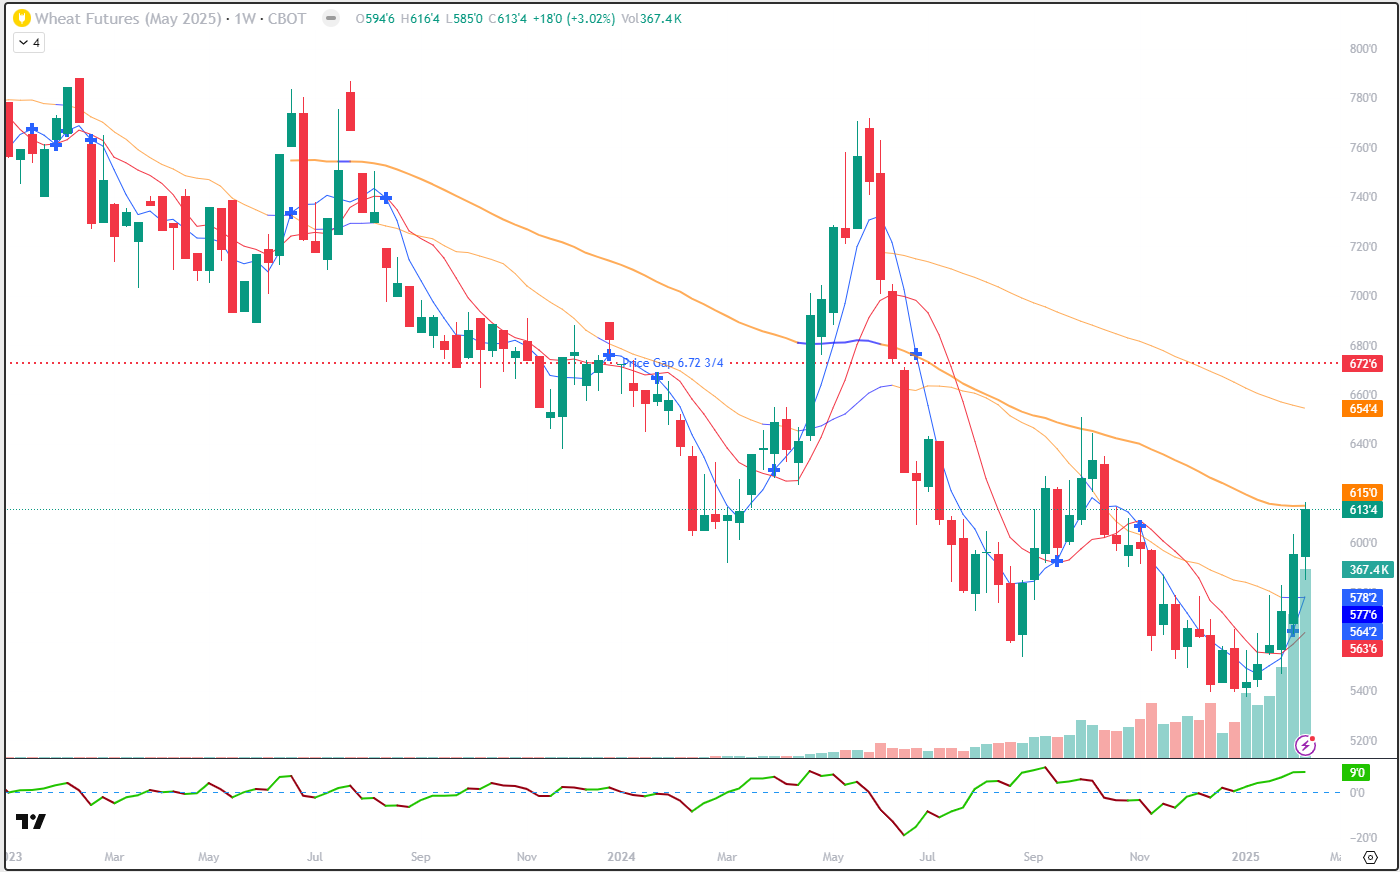
The weekly chart above goes back a little over 2 years. And with the exception of June-July of 2023 and March-June of 2024, it has been in a solid downtrend. However, you may notice that small blue cross in last week’s bar, indicating a shift in the 5-10 week trend. This makes 6 consecutive weeks of price gains, which is unusual behavior for this market. I can’t say it’s never happened before, but on this chart, there haven’t been 6 straight weeks of anything. Even when prices dropped aggressively last year, a 5 week streak was the best it could do. So while the overall trend is still down, it does appear to me that a rally is underway. Initial support on the weekly chart may be found near last week’s high of 6.03 1/2. Beyond that, I would look to the 5-week average (blue) near 5.78 ¼, the 20-week average (just turned blue in past two weeks, was orange) near 5.77 and the 10-week (red) near 5.63 ¾. Overhead resistance might be found near the 50-week average (orange) near 6.15 and to the 6.50-6.54 ½ level, near the 100-week average and a fat, round number. Beyond that….there is a gap on this chart. To fill that, we’ll need to see May Wheat at 6.72 ¾.
If you’re the speculative type and you prefer options, perhaps consider May 6.70 calls, targeting that gap. They have 70 days until expiration and settled at 15 5/8 today. That’s $781.25, plus fees and commissions. Perhaps setting a target order to double what you spent and another stop (mental or actual) risking ½ of what you paid would work out well for you.
May Wheat (seasonal)
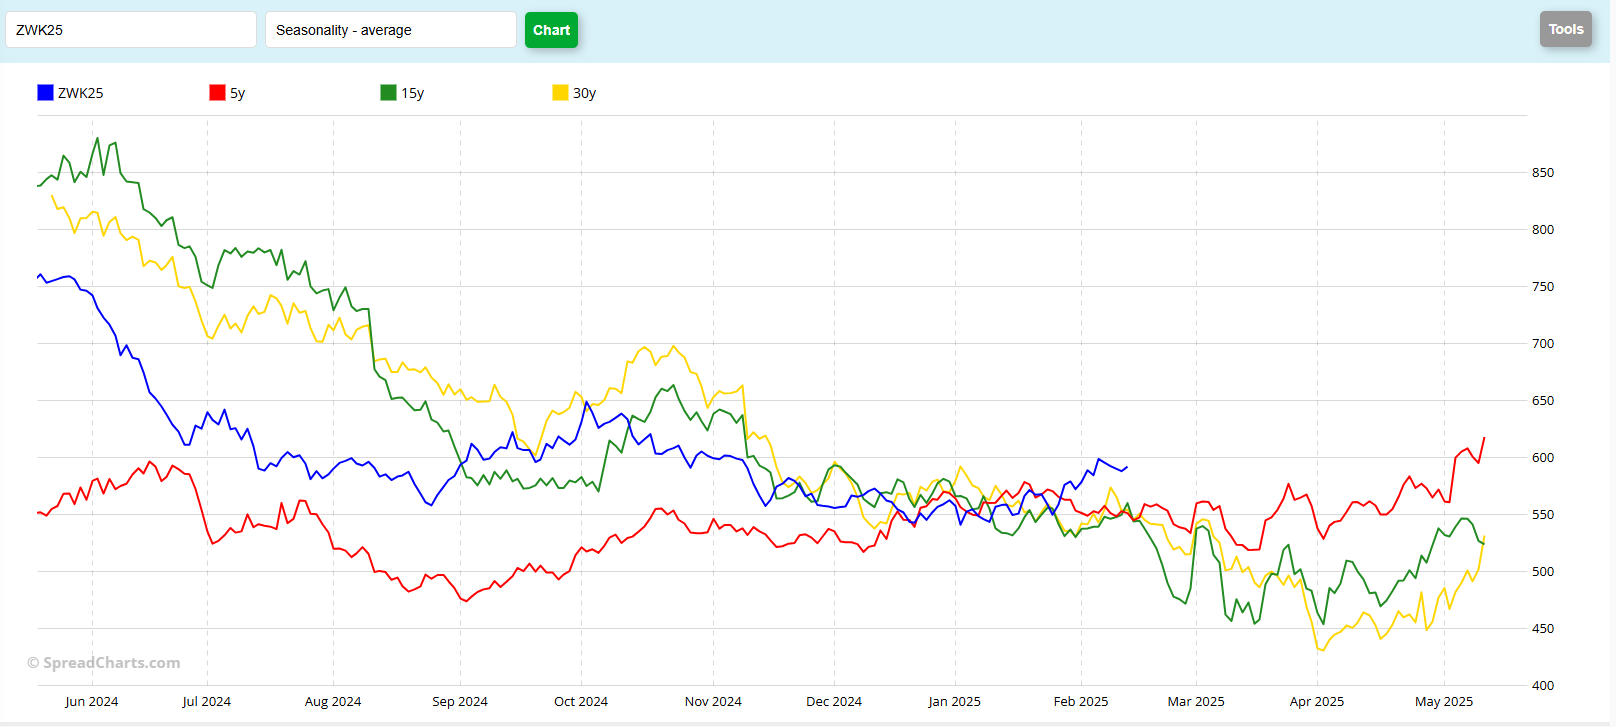
The May Wheat seasonal chart seems to look a little better than most seasonal charts these days. While there is some time deviation apparent, generally speaking, the price patterns seem fairly consistent to my eye. The market has trended lower, matching historical patterns, at least from my point of view. The time deviation that I mentioned, is my way of saying that the highs/lows of this contract, while sticking to the overall picture, seem to have occurred earlier than expected. For example, the lows in the current contract (blue) from last August came about a week before the 5-year (red) pattern made its low, and about 3 weeks before the 15- (green) and 30-(yellow) year patterns made theirs. Subsequently, the peaks in October also arrived in the current contract weeks before the historicals indicated. In late January, however, I notice a deviation seemingly start. That has continued through to this point in February. Looking forward, the 5-year pattern suggests a choppy, higher market until expiration and the 15-and 30 years show a choppy, lower market until about the middle of April, before turning higher into expiration. You might notice the current contract started to turn up in January, clearing the congestion with the historical data. Do you think this push higher can continue?
If you have any questions or comments, please reach out and let me know!
Jefferson Fosse Walsh Trading
Direct 312 957 8248 Toll Free 800 556 9411
jfosse@walshtrading.com www.walshtrading.com
Walsh Trading, Inc. is registered as a Guaranteed Introducing Broker with the Commodity Futures Trading Commission and an NFA Member.
Futures and options trading involves substantial risk and is not suitable for all investors. Therefore, individuals should carefully consider their financial condition in deciding whether to trade. Option traders should be aware that the exercise of a long option will result in a futures position. The valuation of futures and options may fluctuate, and as a result, clients may lose more than their original investment. The information contained on this site is the opinion of the writer or was obtained from sources cited within the commentary. The impact on market prices due to seasonal or market cycles and current news events may already be reflected in market prices. PAST PERFORMANCE IS NOT NECESSARILY INDICATIVE OF FUTURE RESULTS. All information, communications, publications, and reports, including this specific material, used and distributed by Walsh Trading, Inc. (“WTI”) shall be construed as a solicitation for entering into a derivatives transaction. WTI does not distribute research reports, employ research analysts, or maintain a research department as defined in CFTC Regulation 1.71.