
The information and opinions expressed below are based on my analysis of price behavior and chart activity
May Soybeans (Daily)
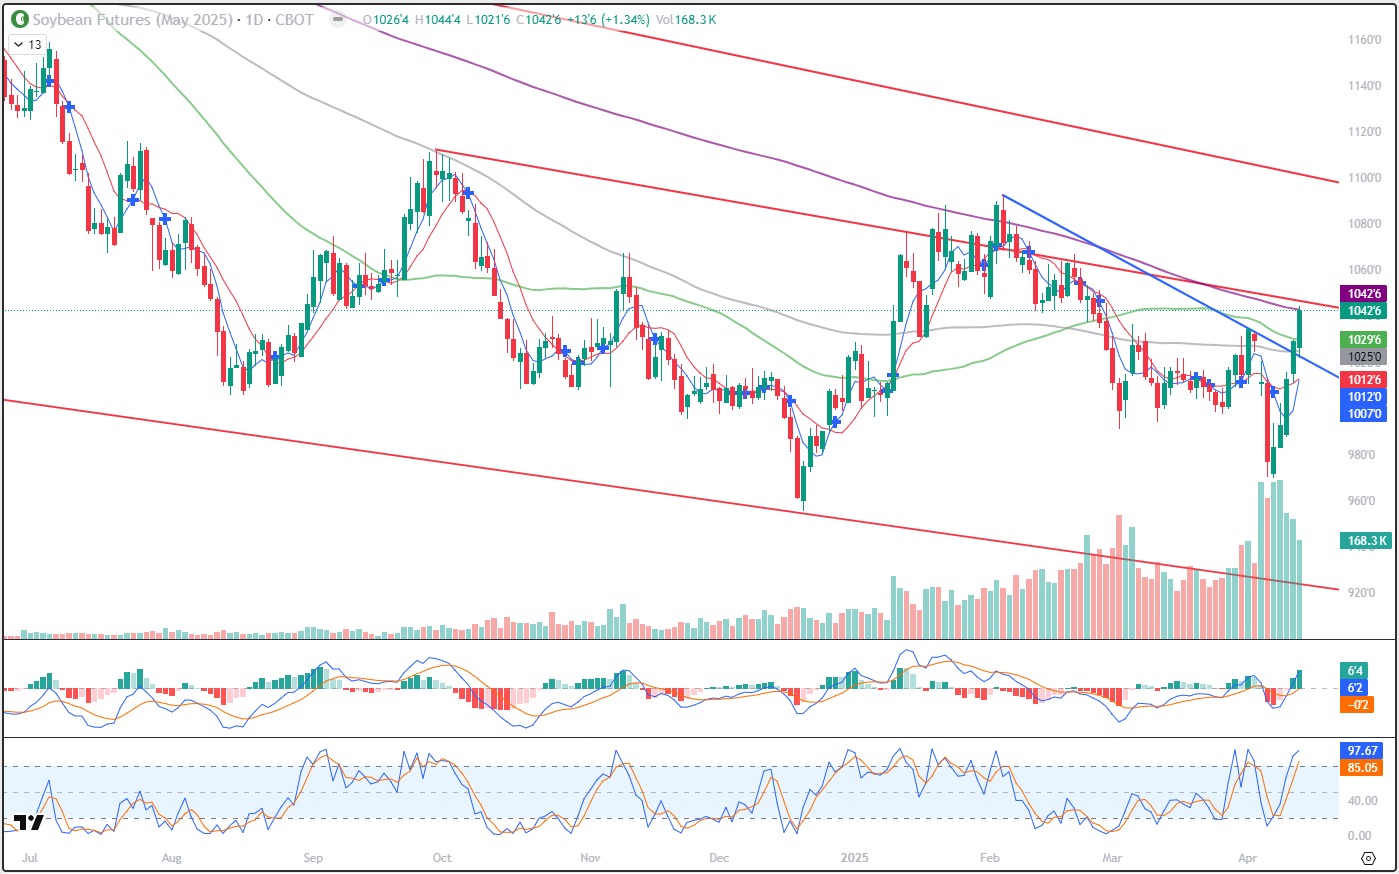
May Soybeans closed at 1042 ¾ on Friday, up 13 ¾ on the day. That is the highest close since February 25th and right on the 200-day moving average. The 200 day is often used as a long-term trend indicator. May Beans have only closed over that measure once, February 4th , over the past year. It will be interesting to see if next week can continue the strength. To my eye, it appears they will. During the most recent downward push, as bearish and as heavy as the market got, it failed to set new lows for the move or re-test the December contract low. And since we’re seeing prices rip back higher, to my eye that suggest a move to the February 5th high of 1092 ½ or beyond. There is nearby overhead resistance that I see besides that 200-day average (purple). You might notice the red trendline and that level is about 1047. Beyond that is the big, fat, round number of 1050. From there, perhaps 1060 or the Feb 21st high of 1066 ¾. Support could be found near the April 1st high (1034 3/4) the 50-day moving average (green) near 1029 ¾, and the 100-day (grey) at 1025. There’s also the blue trendline, which is right on today’s low at 1021 ¾. The short-term average that I have on here, the 5- and 10-day averages (blue, red, 1012 and 1012 ¾, respectively) are thisclose to making a bullish crossover. Aggressive and well-margined traders may do well to consider long futures positions in May Soybeans. Those that prefer using Options, keep in mind that the May Options expire two weeks from today. The May 1050 Calls settled at 9 ½ cents today, or $475 before commissions and fees. Realistically, I think if you’re trading in the futures, you’ll need to have a stop wider than 10 cents, or more than a $500 risk, so those Calls could be a better value if the rally continues apace.
May Soybeans (Weekly)
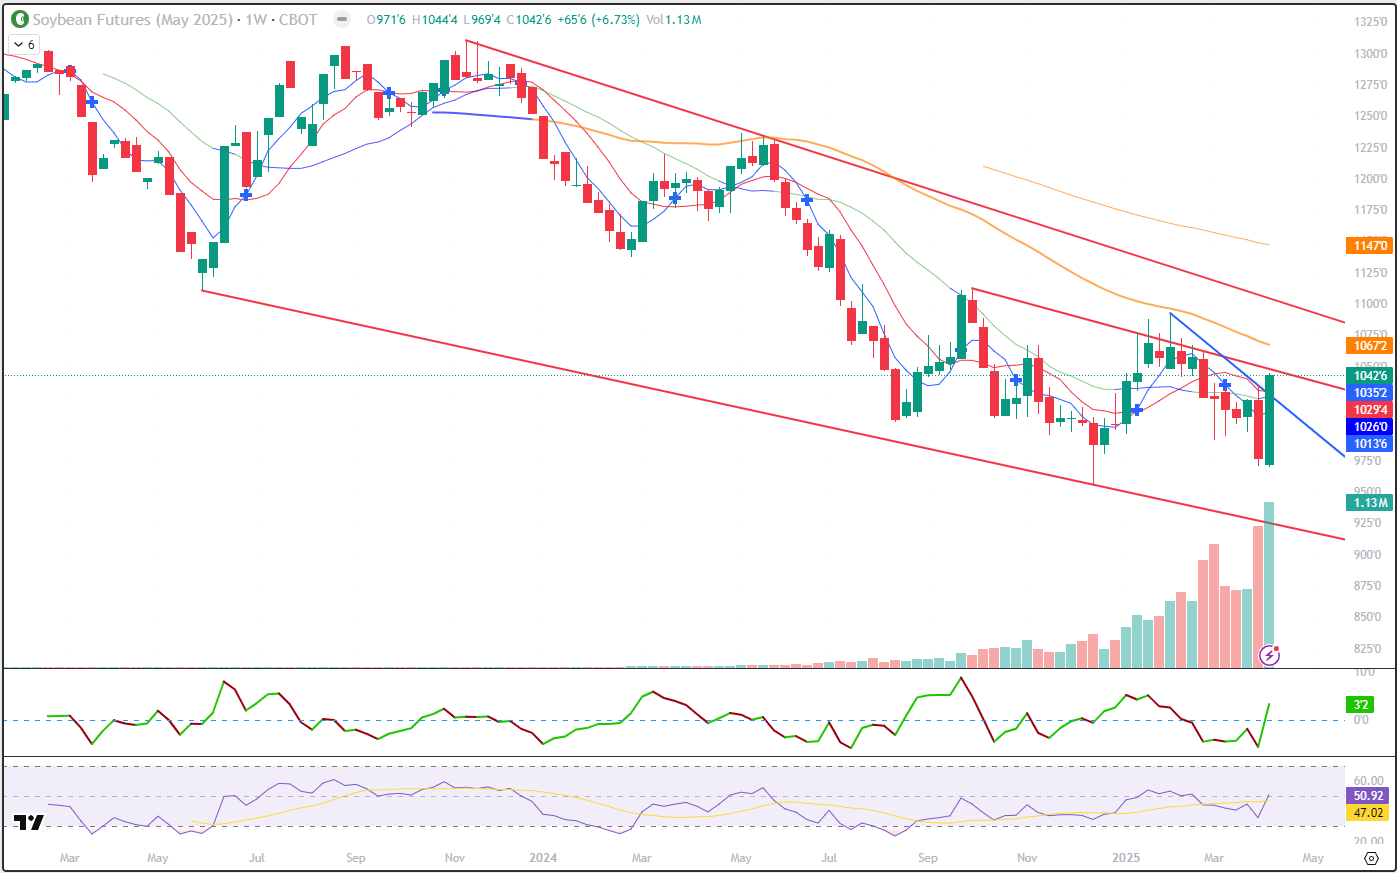
The May Beans posted a very large Bullish Engulfment on the weekly chart this week. Futures opened the week lower than last week’s close and settle higher than last week’s open. Normally, I would expect that to be a bullish signal. Full stop. But, when scanning though this chart, I can find this same pattern happening 4 times previously over the life of May Beans. And it was only “bullish” once, Oct-Nov ’23, for a relatively small rally. The other 3 times resulted in aggressively lower prices. That data sample may be small, but it is worth nothing. I do see moving average support near 1013 ¾ (5-week, blue), 1026 (20-week, also blue) and 1029 ½ (10-week, red) along with potential trendline support (blue line) near 1027 (1021 or so, moving to next week’s bar). Last week’s high of 1034 ¾ may offer some support, as well. There is still trendline (red) resistance near 1048 today, 1045 if I move to next weeks’s bar. I also have the 50-week (orange) at 1067 ¼ and the 100-week average at 1147 (also orange). On the way there, there are also the last 3 weekly highs in Feb, at 1061, 1066 ¾ and 1072 ¾ that may be some resistance. This week’s trade took out the previous 5 week’s worth of trade completely, closing at the highest level in 7 weeks. I think that’s bullish. The previous engulfments that I mentioned were not nearly that dramatic. It’s been a strong week for Beans and I’m still optimistic for further strength, but we’ve still got a ways to go (up) before the long term down trend is broken.
May Soybeans (Seasonal)
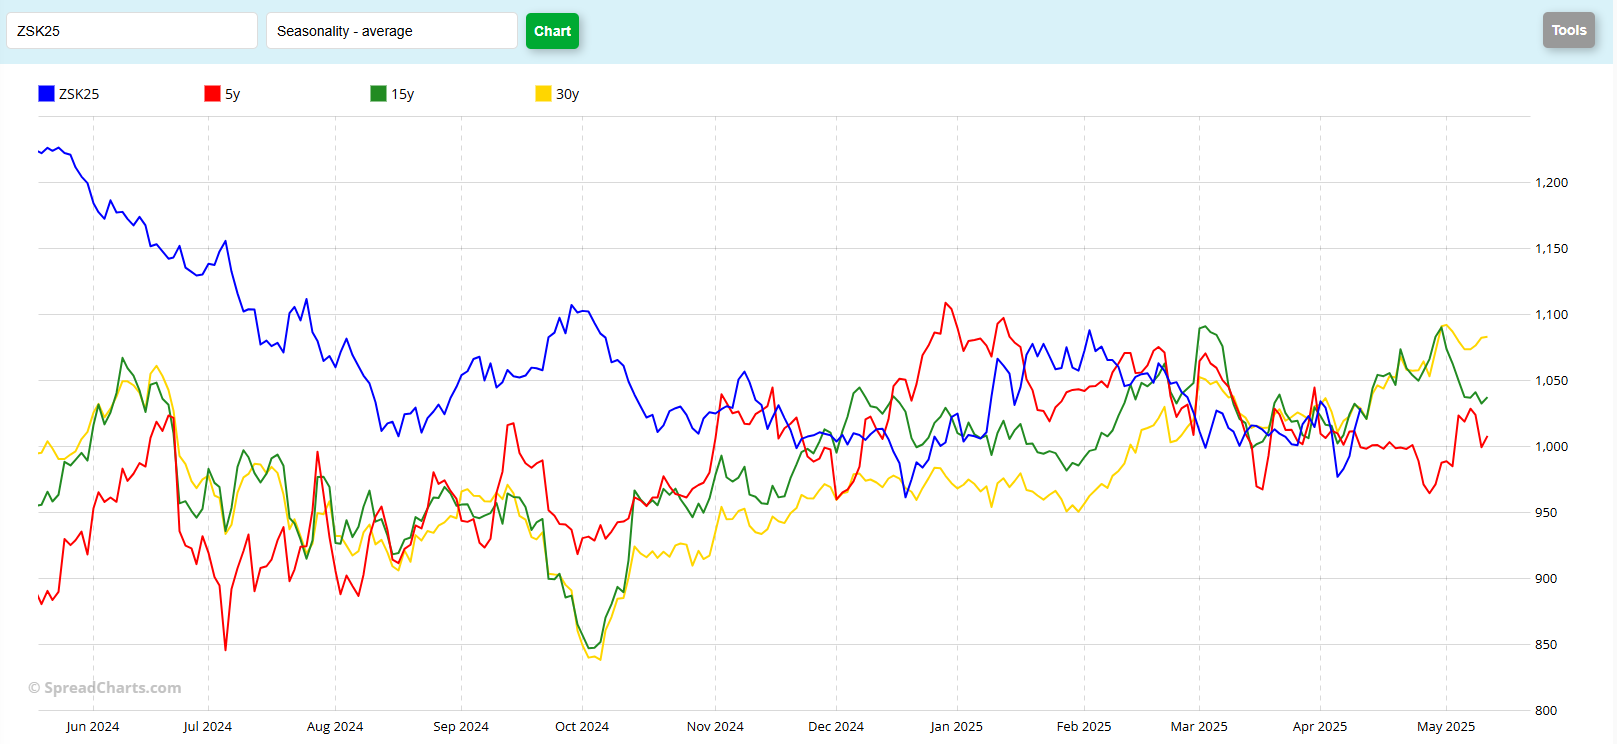
The longer-term seasonal patterns, 15-year and 30-year (green, yellow) seem to suggest a rally in Soybean prices through the end of April. The shorter-term pattern, the 5-year (red) seems to suggest the opposite, with sideways to lower history over the month of April. The historical data indicates that both the 15- and 30-year patterns make a low on April 4th (last Friday) and rally until April 30th. This year’s current trade also indicates that the May contract made a low on that date. The subsequent rallies amounted to a little over 88 cents in the 15-year pattern and 80 cents in the 30-year. As of Friday’s close, the current May contract has rallied 65 ¾ from last week’s close. So far, a very strong move. The seasonal patterns suggest perhaps another 15 cents or so higher before eclipsing the seasonal peaks. The 5-year pattern suggests a drop from April 7th (a day later) to it’s low on April 28th. Historically that works out to a decline of over 36 cents. That would put the current May contract near the 941 level. That outcome seems unlikely to me, given where prices are, but stranger things have happened. What do you see in May Beans?
Jefferson Fosse Walsh Trading
Direct 312 957 8248 Toll Free 800 556 9411
jfosse@walshtrading.com www.walshtrading.com
Walsh Trading, Inc. is registered as a Guaranteed Introducing Broker with the Commodity Futures Trading Commission and an NFA Member.
Futures and options trading involves substantial risk and is not suitable for all investors. Therefore, individuals should carefully consider their financial condition in deciding whether to trade. Option traders should be aware that the exercise of a long option will result in a futures position. The valuation of futures and options may fluctuate, and as a result, clients may lose more than their original investment. The information contained on this site is the opinion of the writer or was obtained from sources cited within the commentary. The impact on market prices due to seasonal or market cycles and current news events may already be reflected in market prices. PAST PERFORMANCE IS NOT NECESSARILY INDICATIVE OF FUTURE RESULTS. All information, communications, publications, and reports, including this specific material, used and distributed by Walsh Trading, Inc. (“WTI”) shall be construed as a solicitation for entering into a derivatives transaction. WTI does not distribute research reports, employ research analysts, or maintain a research department as defined in CFTC Regulation 1.71.