
The information and opinions expressed below are based on my analysis of price behavior and chart activity
May Soybeans (Daily)
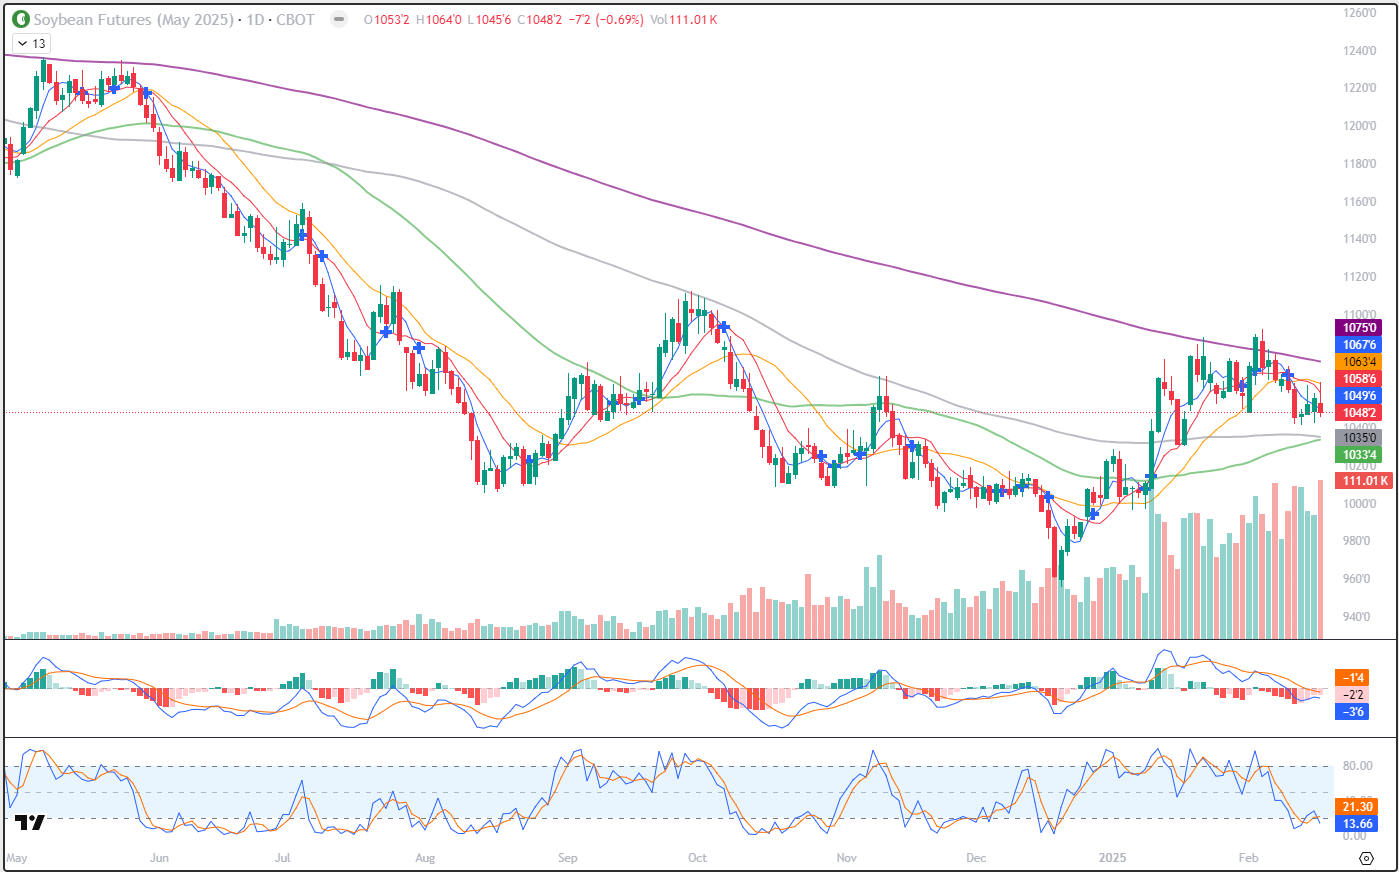
Today, May Soybeans settled at 10.48 ¼, down 7 ¼ cents. Volume was high at just over 111,000 contracts traded, setting a new volume high for May futures. The close pushed prices back below the 5- (blue) and 10-day (red) moving averages, at 10.49 ¾ and 10.58 ¾, respectively. You may notice that in late January and then again in the first week of February that prices tested that 200-day moving average (purple) before falling back. Today that average is valued at 10.75, a price we have not seen for 10 days or so. To my eye, that 200-day average is critical resistance. You’ll notice the double test of that average this past May, followed by a 7 month sell-off. Both the 50-(green) and 100-day (grey) averages are below the market, offering potential support near 10.33 ½ and 10.35. They have been converging, as of late, but have not yet made that “bullish crossover” which would give some fresh ammo to the bulls out there. While it’s true that prices have bounced nicely off of their lows since mid-December, the downtrend is still dominant, in my opinion. A large South American crop is looming and our window for Soybean exports is rapidly closing. Brazil’s crop was last estimated by the USDA at 169 MMT, well above their 5-year average of 142.7 MMT. (source) FYI, US production is roughly 119 MMT, according to the Feb WASDE. Stochastics (lowest sub-graph) are in oversold territory and currently pointing lower. The MACD indicator, just above that, is also pointing toward price weakness, to my eye. The 5-and 10-day averages on my chart flipped to the “sell” side last week, as denoted by the blue cross on February 11th.
May Soybeans (Weekly)
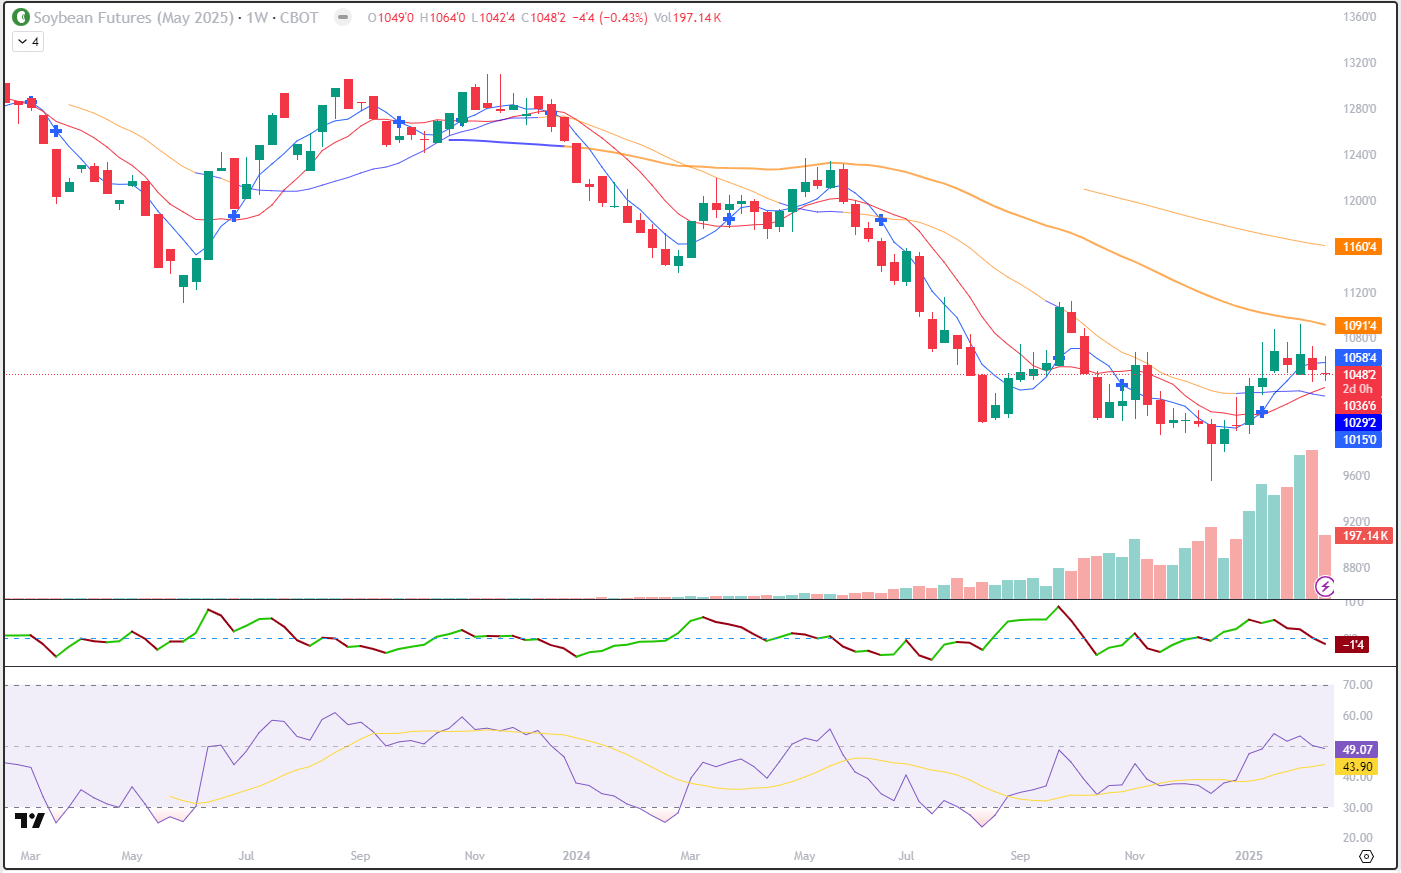
The weekly chart of May Beans looks to me like a market that is attempting to change a trend. I’m not completely convinced that it has been successful yet. The 5-and 10-week averages did flip to the “buy” side 6 bars or weeks ago. That’s again denoted by the blue cross and was at 10.15. Currently, the 5 week (blue) is at 10.58 ½ (resistance) and the 10-week (red) is at 10.36 ¾ (support) The 20-week average (was orange or down, changed to blue or up about 7 weeks ago) but is pointing down now and is at 10.29 ¼. The recent highs at 10.92 ½ did NOT set new highs for the move and breach the September high of 11.12 ¼. Until the weekly chart closes above the 50-week average (orange) up at 10.91 ½, I feel the downtrend is still intact. If we do see a close like that, I think the Sept high is easily within reach. I’m not hugely bearish nor bullish, at this time. But I do think that our export window vs Brazil is shrinking and soon the world will turn to them for Soybeans. When that occurs, our market will have little reason to rally on its own and will look to the rest of the world for directional clues. The tariff “war” will also be interesting to watch. As of now, there hasn’t been any real impact on the Ag markets. Lots of frothy speculation, but nothing actual has happened. I think the upside may be capped by competition from South America, specifically, and the downside may be limited by a need to “inflation adjust” Ag prices, in general. But that’s a completely different topic.
May Soybeans (Seasonal)
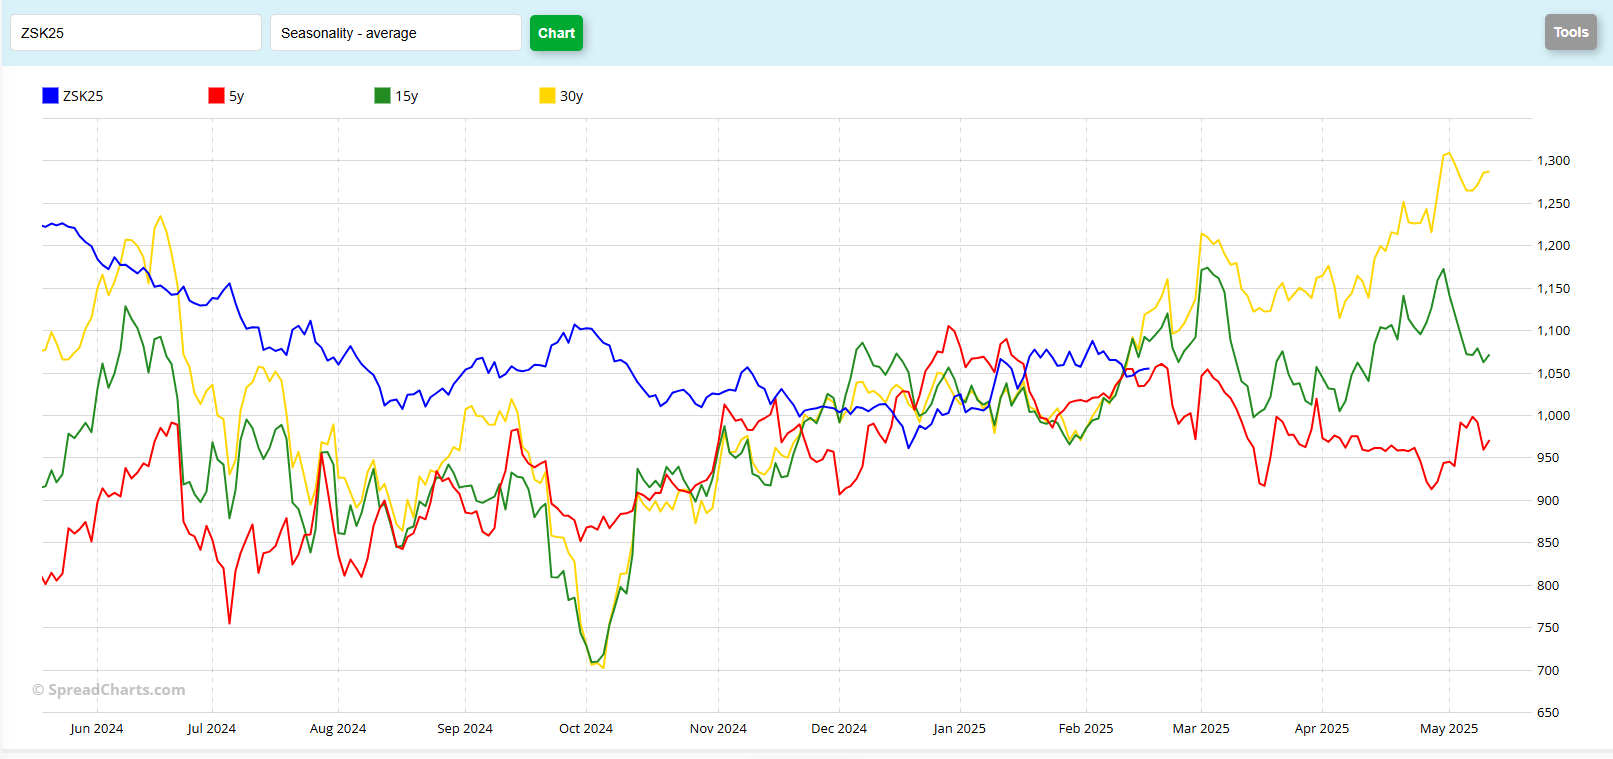
The seasonal chart for May Beans isn’t currently offering much in the way of clues, in my opinion. An observation can be made that this market has been out of sync for a while now. For example, the current May contract was making highs in early October, when the historical patterns show the market typically making lows during that time frame. There are times when it appears to be in line, like the downtrend late last summer, but the recent few months have been coincidental, I think. Looking forward, what does this chart tell us? The blip lower at the end of this month is due to contract rollover pressure, as traders roll positions from March to May, I believe. After that, it appears that it’s anybody’s guess. The 5-year pattern (red) suggests weakness until contract expiration. The 15-year (green) suggests a choppy market that works lower through mid-March, followed by a rally. The 30-year pattern (yellow) also indicates weakness into the middle of March, followed by a rally over 1.50 into expiration. How did I figure that? The low value on March 14th was 11.22 ½, roughly, value at expiration was 12.87 ½, roughly, a difference of 1.65. The same calculation for the 15-year pattern (9.98-ish to 10.72) is 74 cents and the 5-year pattern (9.17 to 9.71) is 54 cents. Any one of those would be a good result. However, nobody in our world is going to hold positions past First Notice Day, unless they fully intend to make/take delivery. Realistically, the positions will be exited about 2 weeks or so before expiry, certainly by FND on April 30. To my mind, this year may work out more like the 5-year pattern as South American production is expected to be high, with the USDA pegging Brazilian production at 169 MMT, an increase from last year’s 153 MMT.
Jefferson Fosse Walsh Trading
Direct 312 957 8248 Toll Free 800 556 9411
jfosse@walshtrading.com www.walshtrading.com
Walsh Trading, Inc. is registered as a Guaranteed Introducing Broker with the Commodity Futures Trading Commission and an NFA Member.
Futures and options trading involves substantial risk and is not suitable for all investors. Therefore, individuals should carefully consider their financial condition in deciding whether to trade. Option traders should be aware that the exercise of a long option will result in a futures position. The valuation of futures and options may fluctuate, and as a result, clients may lose more than their original investment. The information contained on this site is the opinion of the writer or was obtained from sources cited within the commentary. The impact on market prices due to seasonal or market cycles and current news events may already be reflected in market prices. PAST PERFORMANCE IS NOT NECESSARILY INDICATIVE OF FUTURE RESULTS. All information, communications, publications, and reports, including this specific material, used and distributed by Walsh Trading, Inc. (“WTI”) shall be construed as a solicitation for entering into a derivatives transaction. WTI does not distribute research reports, employ research analysts, or maintain a research department as defined in CFTC Regulation 1.71.