
The information and opinions expressed below are based on my analysis of price behavior and chart activity
May Soybean Oil (Daily)
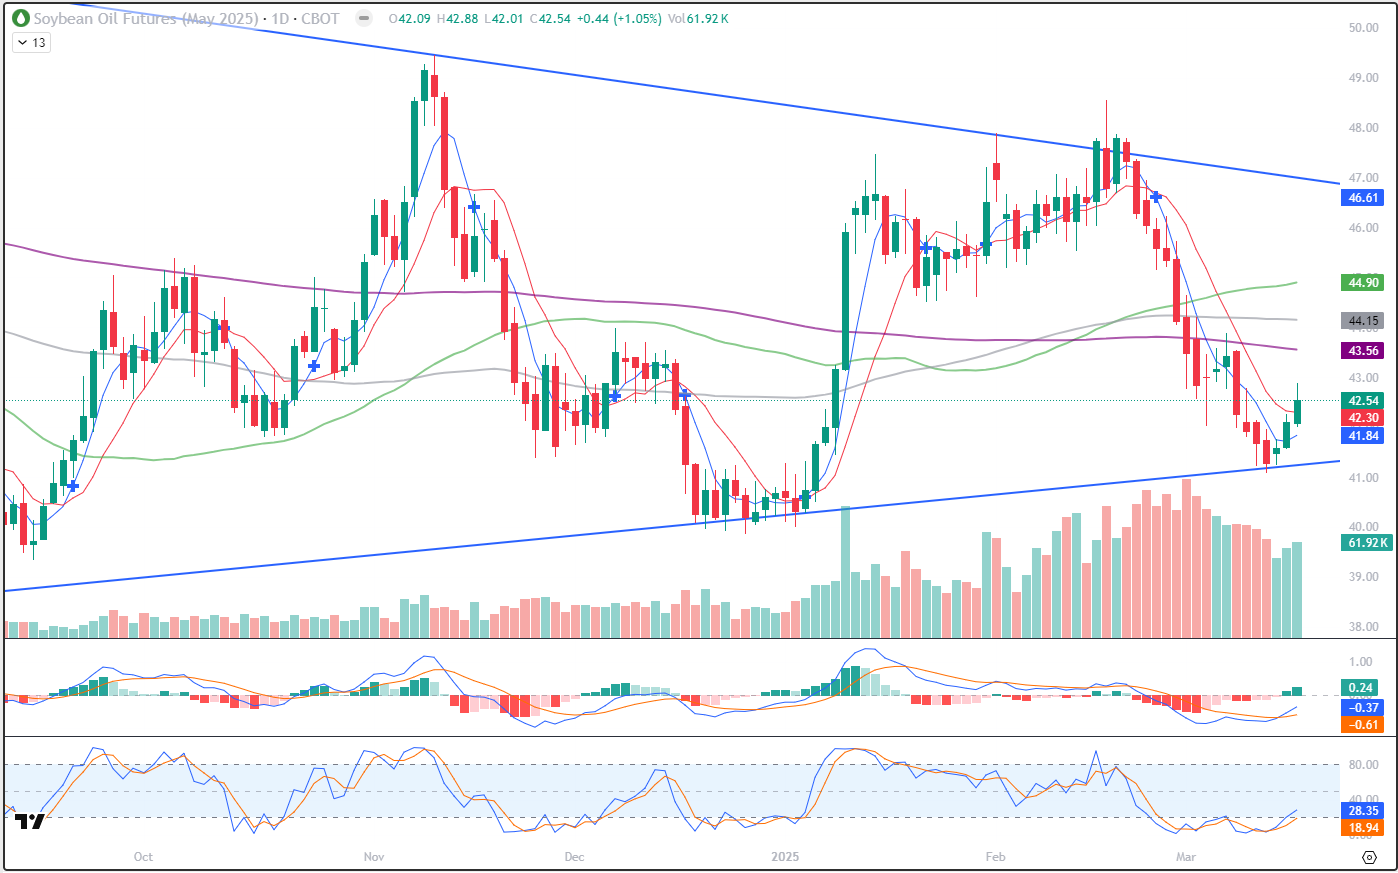
May Bean Oil closed at 42.64 today, up 0.44 on the day. The trendline low was tested last week and we’ve since seen 3 days of positive price movement. Today’s close was also above the 5- and 10-day moving averages (blue, red) which are now offering potential support at 41.84 and 42.30, respectively. The 200-day (purple) 100-day and 50-day averages are all in bullish territory, seeing as how they’ve all made the bullish crossover over the past 6 weeks, starting with the 100/200 on Feb 7th and the 50/100 on Feb 20th. Only one of those, the 50-day (green) is inclined higher right now. Both the 100- and 200-day (purple, grey) are above the market with a slight declination, at the moment. Both the MACD and Stochastics (subgraphs) are hooking back higher, following Monday’s and Tuesday’s trade. A three-day bounce does not change a trend, but I am of the opinion that the trendline support could hold. Highly aggressive and well-margined traders might do well to consider long positions in futures, with an upside target near the 46.00-47.00 range. For risk management, I would suggest either a risk/reverse stop just below 41.00 (last week’s low was 41.08) OR using Put options on at least a 2:1 ratio to your futures position. If you need suggestions on which options or how you might do that effectively, please reach out and contact me directly.
May Soybean Oil (Weekly)
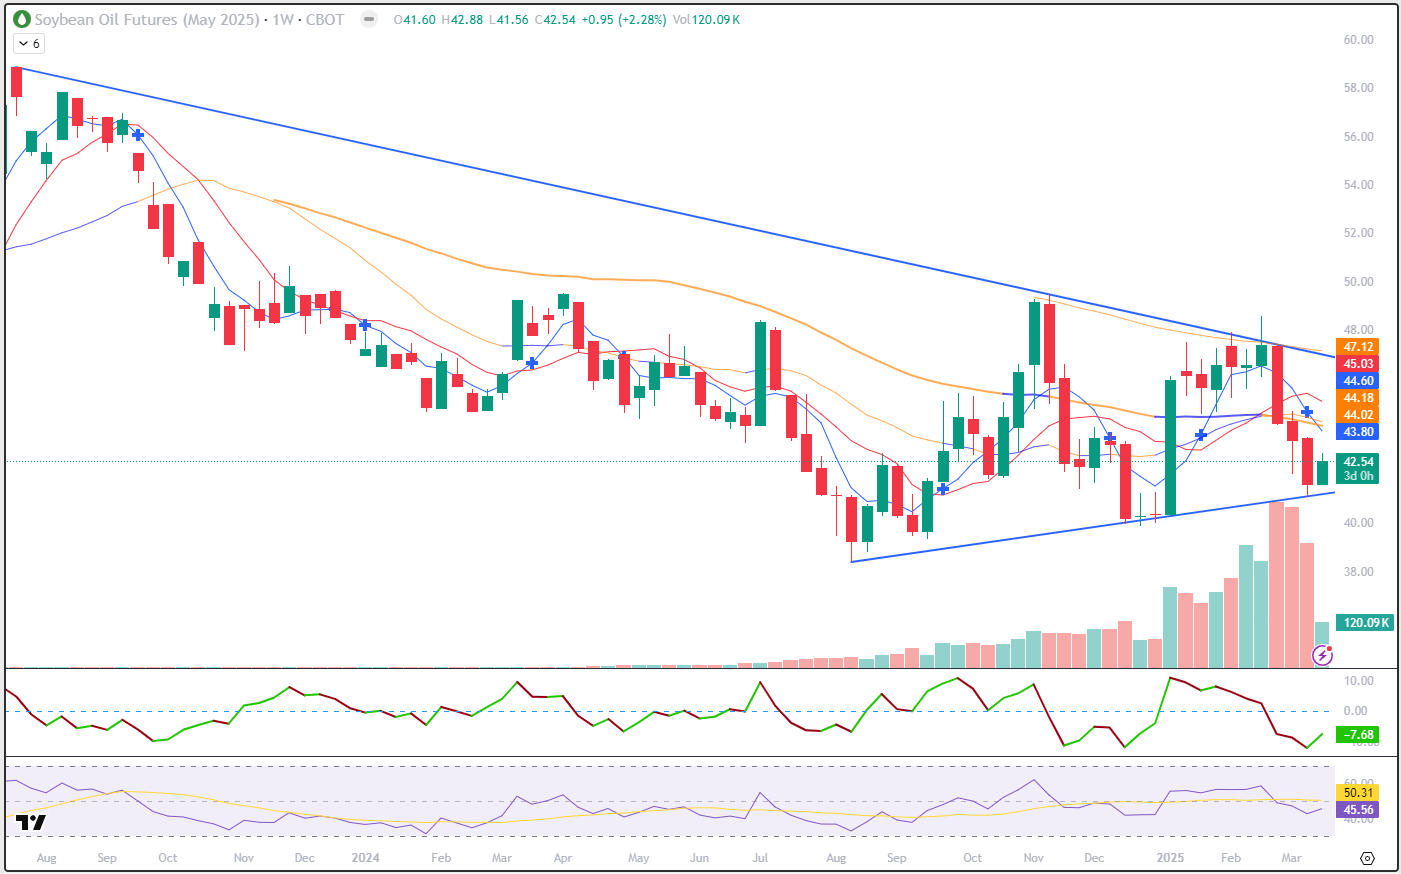
This weekly chart goes back to the contract high, established in the last full week of July 2023. The overhead trendline is drawn off of that high and the high from the 2nd week of November 2024. Today that value is roughly 47.00. The lower trendline is drawn from the lows last August to the low established in the huge green bar in the first week of January. That trendline value is near 41.00 today. The overall trend is still down and you may notice that blue cross in last week’s bar. That indicated the 5- and 10-week moving averages crossing into bearish territory. Today, those are offering potential resistance at 43.80 and 45.03, respectively. The 20-week and the 50-week averages are actually in bullish territory, with the 20-week above the 50-week. I should clarify, the numerical relationship is bullish but the averages are both declining and pointing toward weakness. Thos can be found near 44.18 and 44.02, respectively. There have been 3 consecutive solid weeks of bearish trade, half of the bearish streak from last July-August and equaling the 3 bearish weeks in November. To my eye, this chart is working itself into a corner, with the support/resistance trendlines narrowing in. Last week’s test of support, assuming it holds, may suggest a rally back up near the 46.00-47.00.
May Soybean Oil (Seasonal)
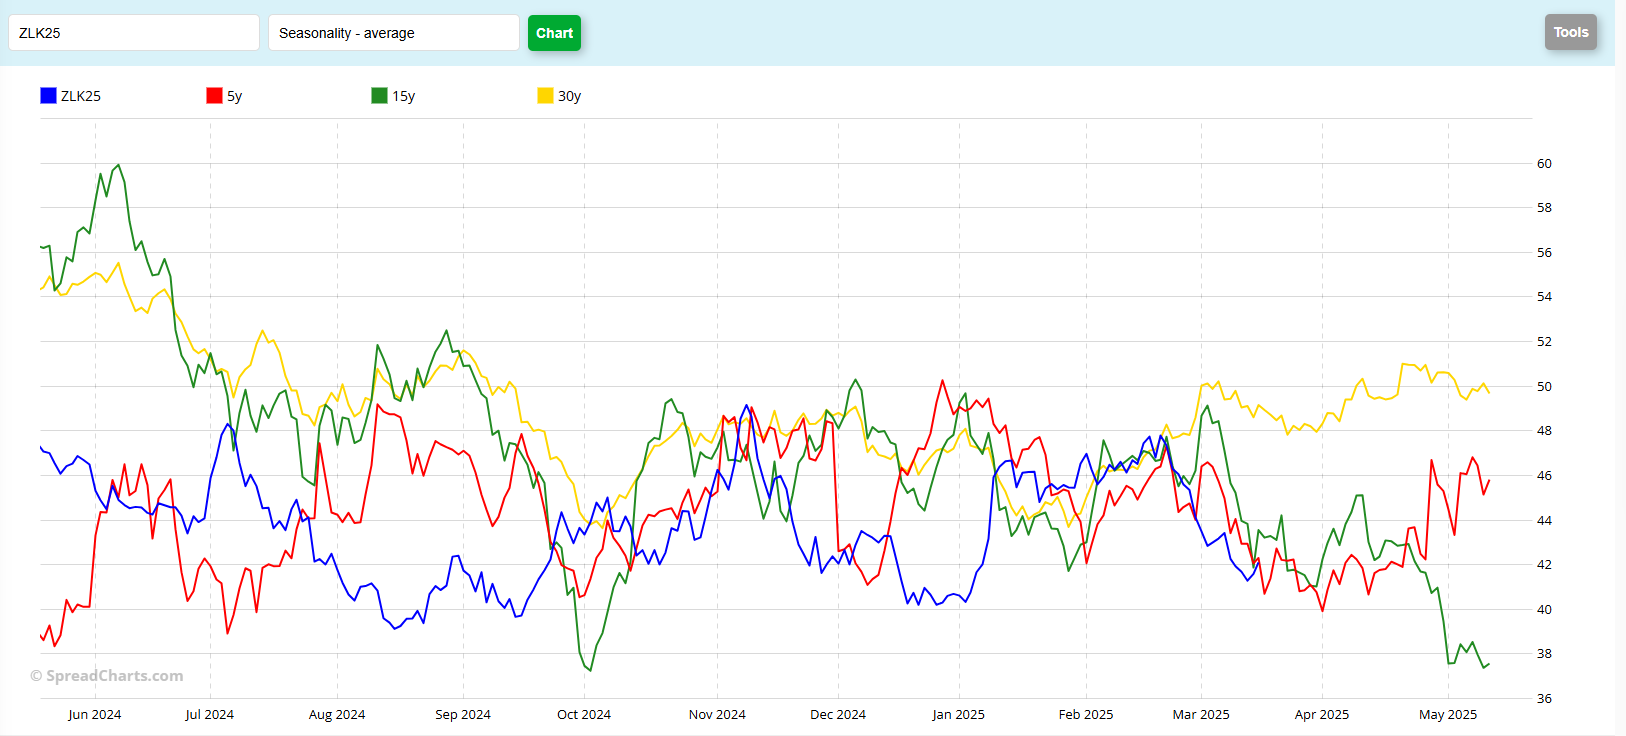
The seasonal Bean Oil chart seems to show a mixed picture to me. There has been a fair amount of “disconnect” if you will, between the current May contract and the historical data over the past year or so. This chart goes back to mid-May of last year. Prices haven’t strayed too far out of the historical norm, but I think you might agree that the highs/lows have come at odd times on this chart. A thumbnail observation seems to look like the current contract has been early, if you will, by about 2-3 weeks, compared to history. I don’t know if that pattern will continue, moving forward. The current market is Blue, the 5-year pattern is Red, 15-year is Green and the 30-year data is Yellow. Looking forward, this chart suggests a lower move for the next week or two, with the historicals all making a low at the end of March-beginning of April. After April 1st, the markets tend to rally until about mid-April. Following that, the historicals go in three different directions. What do you see on this?
Jefferson Fosse Walsh Trading
Direct 312 957 8248 Toll Free 800 556 9411
jfosse@walshtrading.com www.walshtrading.com
Walsh Trading, Inc. is registered as a Guaranteed Introducing Broker with the Commodity Futures Trading Commission and an NFA Member.
Futures and options trading involves substantial risk and is not suitable for all investors. Therefore, individuals should carefully consider their financial condition in deciding whether to trade. Option traders should be aware that the exercise of a long option will result in a futures position. The valuation of futures and options may fluctuate, and as a result, clients may lose more than their original investment. The information contained on this site is the opinion of the writer or was obtained from sources cited within the commentary. The impact on market prices due to seasonal or market cycles and current news events may already be reflected in market prices. PAST PERFORMANCE IS NOT NECESSARILY INDICATIVE OF FUTURE RESULTS. All information, communications, publications, and reports, including this specific material, used and distributed by Walsh Trading, Inc. (“WTI”) shall be construed as a solicitation for entering into a derivatives transaction. WTI does not distribute research reports, employ research analysts, or maintain a research department as defined in CFTC Regulation 1.71.