
The information and opinions expressed below are based on my analysis of price behavior and chart activity
May Corn (Daily)
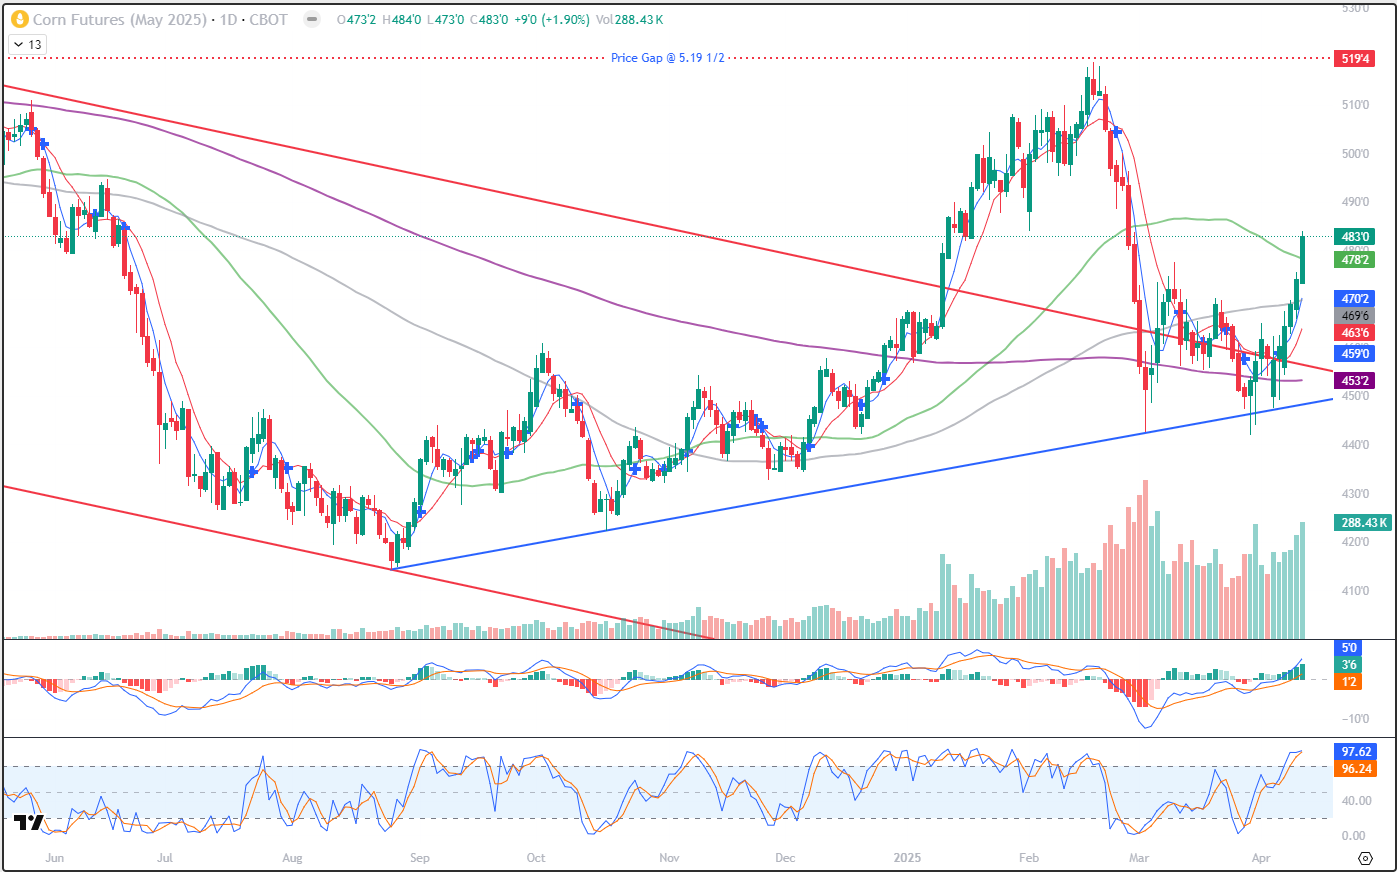
May Corn closed up 9 cents on Thursday, settling at 483. That’s the highest daily close since February 26th. Since testing the blue trendline (drawn off the Aug-Oct lows) last on April 3rd, Corn has posted 6 “green” days in a row, and 5 of those have been positive days. Prices have also tested and cleared the 200-day (purple) 100-day (grey) and 50-day (green) moving averages, with the last two happening yesterday and today. The closest one is the 50-day, at 478 ¼ today, and that may offer the nearest support. The 5- and 10-day moving averages crossed into bullish territory last Friday, as denoted by the blue cross that can (barely) be seen on the chart. The recent tariff whipsaws that have hit other markets, have seemed to have spared the Corn market. I think that it would be good if that continues, but only time will tell. Today, the USDA released their April WASDE and that gave prices a further boost. I won’t get into the fundamental details here, but they did lower the US and World ending stocks and left the South American crop estimate unchanged from last month. Volume today was highest since March 6th, which seems supportive to the market, I think. Looking at the volume bars at the bottom of the chart, you may notice that it has been increasing since the last red day. The MACD (1st subgraph) is pointing higher, and the Stochastics, just below that, at about as overbought as they can get. I think you’ll notice that the market can maintain overbought/oversold status for surprisingly long periods, if the trend is strong enough. See the late-Dec to mid-Feb time period for evidence of that. There is still an overhead gap on the chart, up near 519 ½ and that does seem like a reasonable target to my eye. Support levels may be found near the 50-day average at 478 ¼ and with both the 5-day and 100-day averages near 470. Overhead resistance might be found near 490 and 500 which are nice round numbers. Aggressive and well margined traders may do well to consider long futures positions, if the market pulls back to support. Less aggressive traders may do well to consider Call Options. May options expire in 2 weeks, and depending on the time frame, may be the least expensive choice. If you think you’ll need more time than that, the June option contracts could be a better play. The Corn market may be due for a setback, as we’ve been up all week and tomorrow is Friday, but overall, I do think the trend is for higher prices down the road.
May Corn (Weekly)
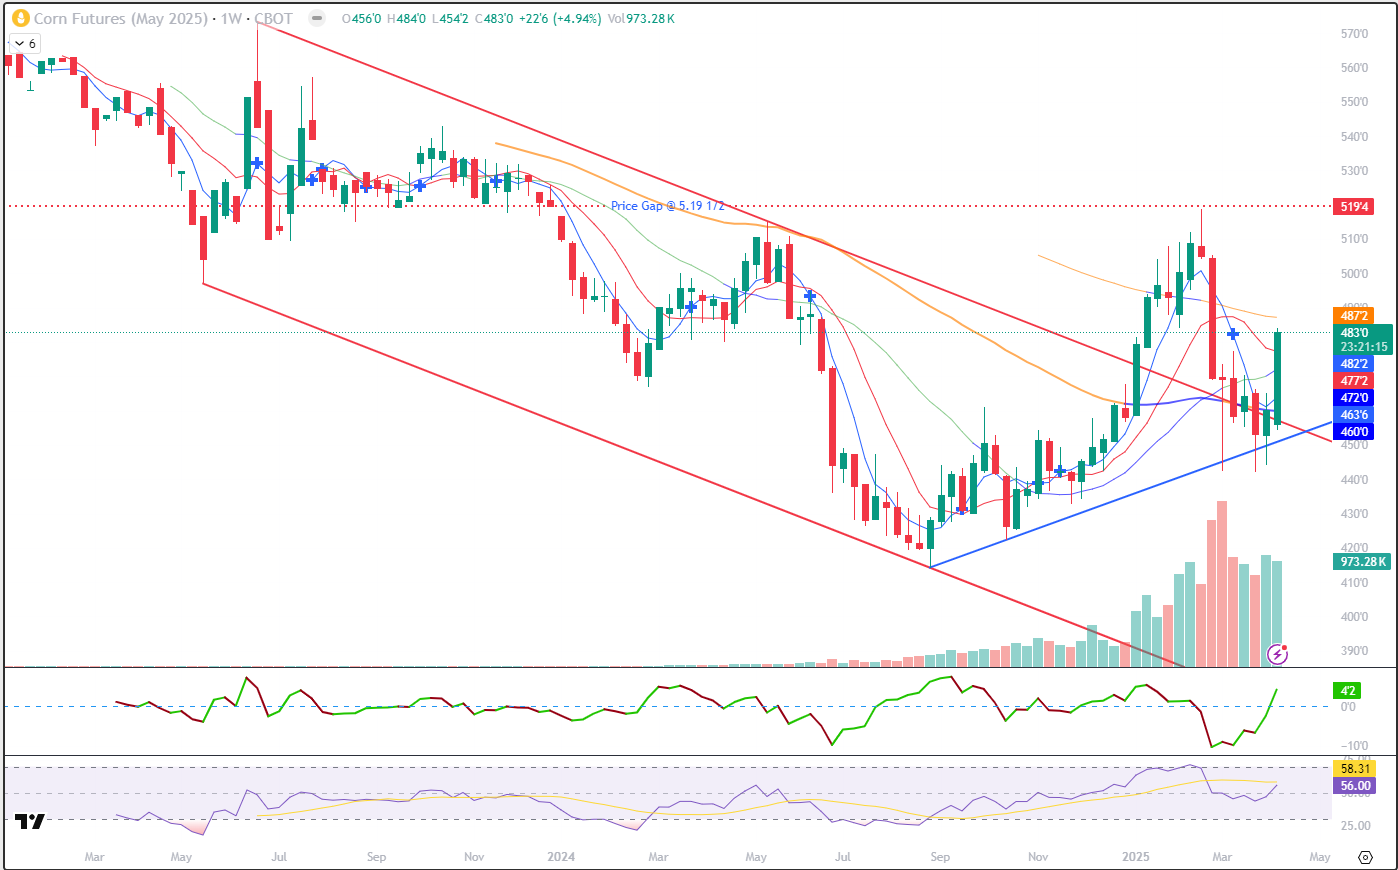
For the week so far, May Corn is up 22 ¾ cents or almost 5%. After failing to fill the gap and starting to fall in mid-Feb, Corn retraced aggressively for two weeks, finding support in the area of the blue trendline that is drawn on the chart. That line I’ve drawn off the lows from last August-October. It hasn’t been able to hold much in the way of gains since then, but the bears haven’t gotten control of the market either. You might notice that the last 6 bars (weeks) have been holding right along the red trendline, drawn off of the June ’23 to May ’24 highs. It almost seems as if the market had been working itself into a corner, so to speak, with this week’s trade breaking up and out of that corner. If it can hold the gains, or even extend them tomorrow, this would mark the best weekly close in over a month. There is still some long-term moving average resistance near 487 ¼, in the form of the 100-week average, but the 20- and 50-week averages are below the market at 472 and 460, respectively, and may offer some support. The 5- and 10-week averages are still in “bearish” territory, as denoted by the blue cross 5 weeks (bars) ago. However, the market is trading above those averages and they may offer additional support levels near 463 and 477, respectively. I would expect to see some resistance at the round numbers, 490, 500, etc. Since the market did not set new lows with the weakness in February and March, I’m of the opinion that the 519 ½ gap is a reasonable upside target, although tariffs and South American crop size will offer headwinds.
May Corn (Seasonal)
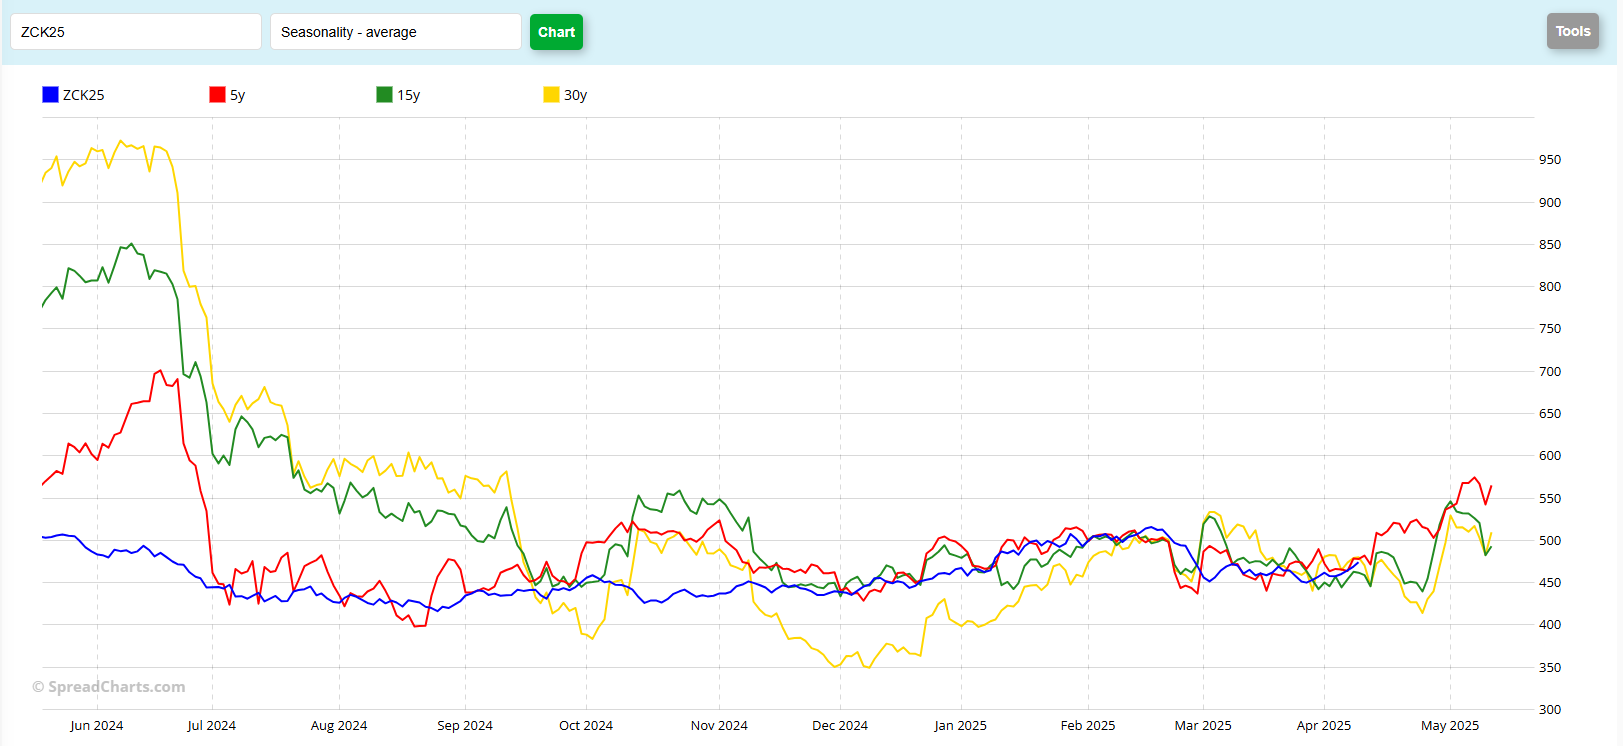
The seasonal May Corn chart seems to indicate higher prices from here, as we move closer to expiration. Both the 15-year (green) and 30-year (yellow) do indicate a dip in prices roughly mid-April before making a rally. The 5-year (red) pattern indicates more of a somewhat consistent move higher. You may notice, looking back in time on this chart, the current contract (blue) only began “matching” historical tendencies in roughly November. Until that time, I see a fairly large divergence, before price behavior came back in line with the 5- and 15-year patterns. The 30-year pattern hasn’t really been a good guide, I think, this whole time. Some of that difference may be due to inflation, in my opinion, and a changing fundamental landscape over the past 30 years. The 5- (especially, to my eye) and 15-year historicals may be a better guide. What do you see?
Jefferson Fosse Walsh Trading
Direct 312 957 8248 Toll Free 800 556 9411
jfosse@walshtrading.com www.walshtrading.com
Walsh Trading, Inc. is registered as a Guaranteed Introducing Broker with the Commodity Futures Trading Commission and an NFA Member.
Futures and options trading involves substantial risk and is not suitable for all investors. Therefore, individuals should carefully consider their financial condition in deciding whether to trade. Option traders should be aware that the exercise of a long option will result in a futures position. The valuation of futures and options may fluctuate, and as a result, clients may lose more than their original investment. The information contained on this site is the opinion of the writer or was obtained from sources cited within the commentary. The impact on market prices due to seasonal or market cycles and current news events may already be reflected in market prices. PAST PERFORMANCE IS NOT NECESSARILY INDICATIVE OF FUTURE RESULTS. All information, communications, publications, and reports, including this specific material, used and distributed by Walsh Trading, Inc. (“WTI”) shall be construed as a solicitation for entering into a derivatives transaction. WTI does not distribute research reports, employ research analysts, or maintain a research department as defined in CFTC Regulation 1.71.