
The information and opinions expressed below are based on my analysis of price behavior and chart activity
May Corn (Daily)
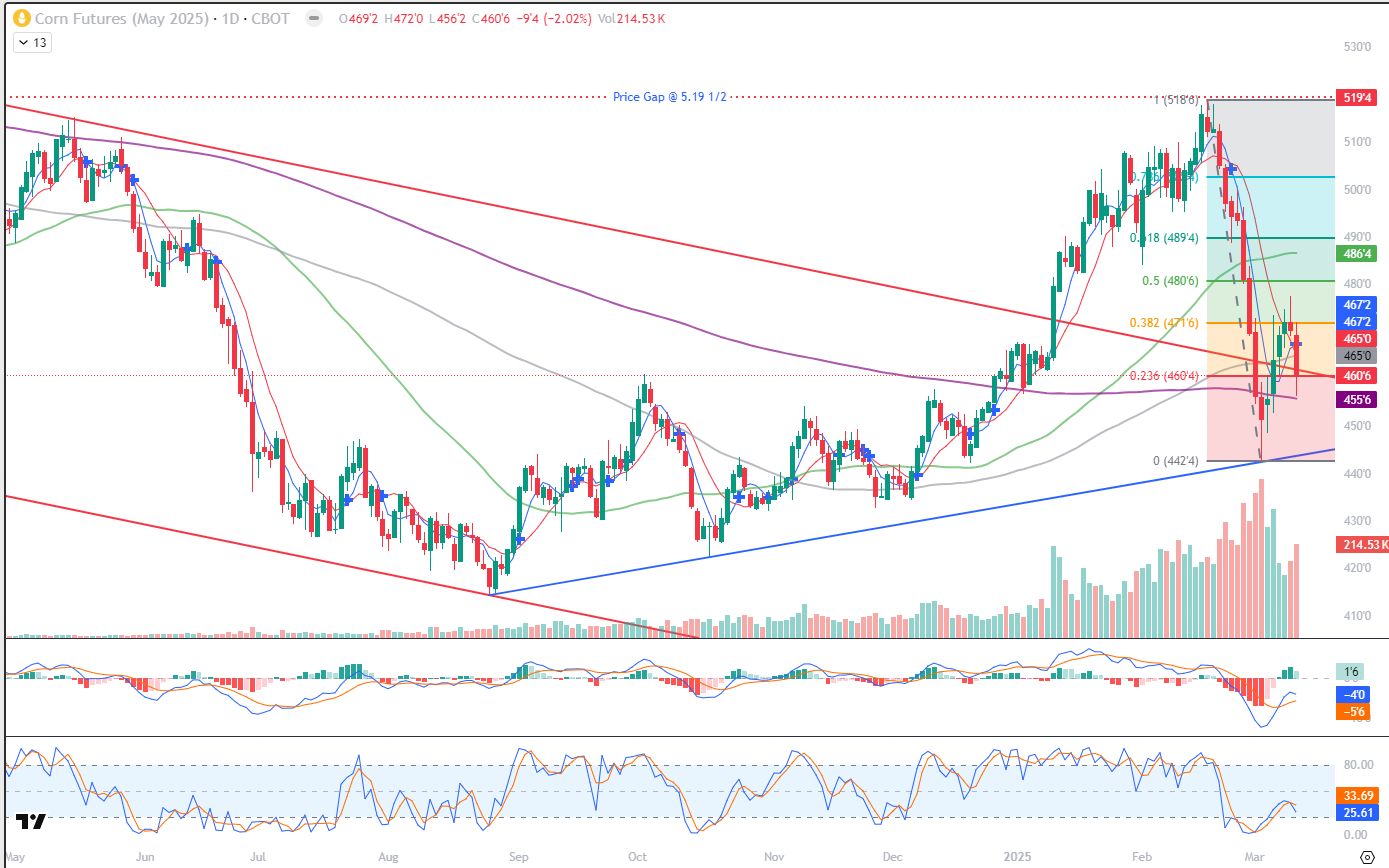
Today, May Corn settled at 4.60 ¾, down 9 ½ cents on the day. Yesterday’s WASDE report gave no ammo to the Bulls, in my opinion, and the tariff war or confusion isn’t helpful either. On this daily chart, you might notice a few things. Last week’s low bounced nicely away from the blue trendline support, drawn off the August and October lows. Today, prices got close to the 200-day moving average (purple) which is at 4.55 ¾ and an indicator of long term-trend. It wasn’t touched or tested, but the contract did shy away from that level and rally some. Today’s close was just below that red trendline, as well, and that price is roughly 4.62 today. We also see the close below the 100-day (grey, 4.65) the 10-day, (red, also at 4.65) and the 5-day averages (blue, 4.67 ¼) The 4 day rally that prices saw until yesterday, has also flipped the 5- and 10-day to a bullish crossover (blue cross within today’s bar) Given that there’s a ton of uncertainty surrounding tariffs and trade, I don’t think it’s wise to blindly step up and buy futures here. The reason that I think that is because that 4-day rally seems to have been stopped by the 38% Fibonacci retracement of that drop from 5.18 ¾ to 4.42 ½. That seems more like bearish activity than bullish to me. Stochastics, in the lowest subgraph, are hooking back down, after relieving the oversold condition and the MACD just above that is also waning a bit. Volume in the May was also highest today since last Thursday. I think that the market is trading a bit on the bearish side, so I’m ignoring that bullish crossover for now. I think that might be best played by using a buy stop at or near the 4.67 ¼ level, where that crossover occurred, to establish a long position. In other words, buy it on strength. 4.40 May Puts seem like they have good value to me, closing at 6 ¾ cents or $337.50 before commissions and fees. If the market does reverse back up, those will serve to reduce your margin requirement that might be established in the previous sentence. If it does not reverse back up, perhaps a profit target at 2x what you spent on the puts would work for you. There may even be the potential for more than that, as the at-the-money 4.60 put closed at 14 ¾ today.
May Corn (Weekly)
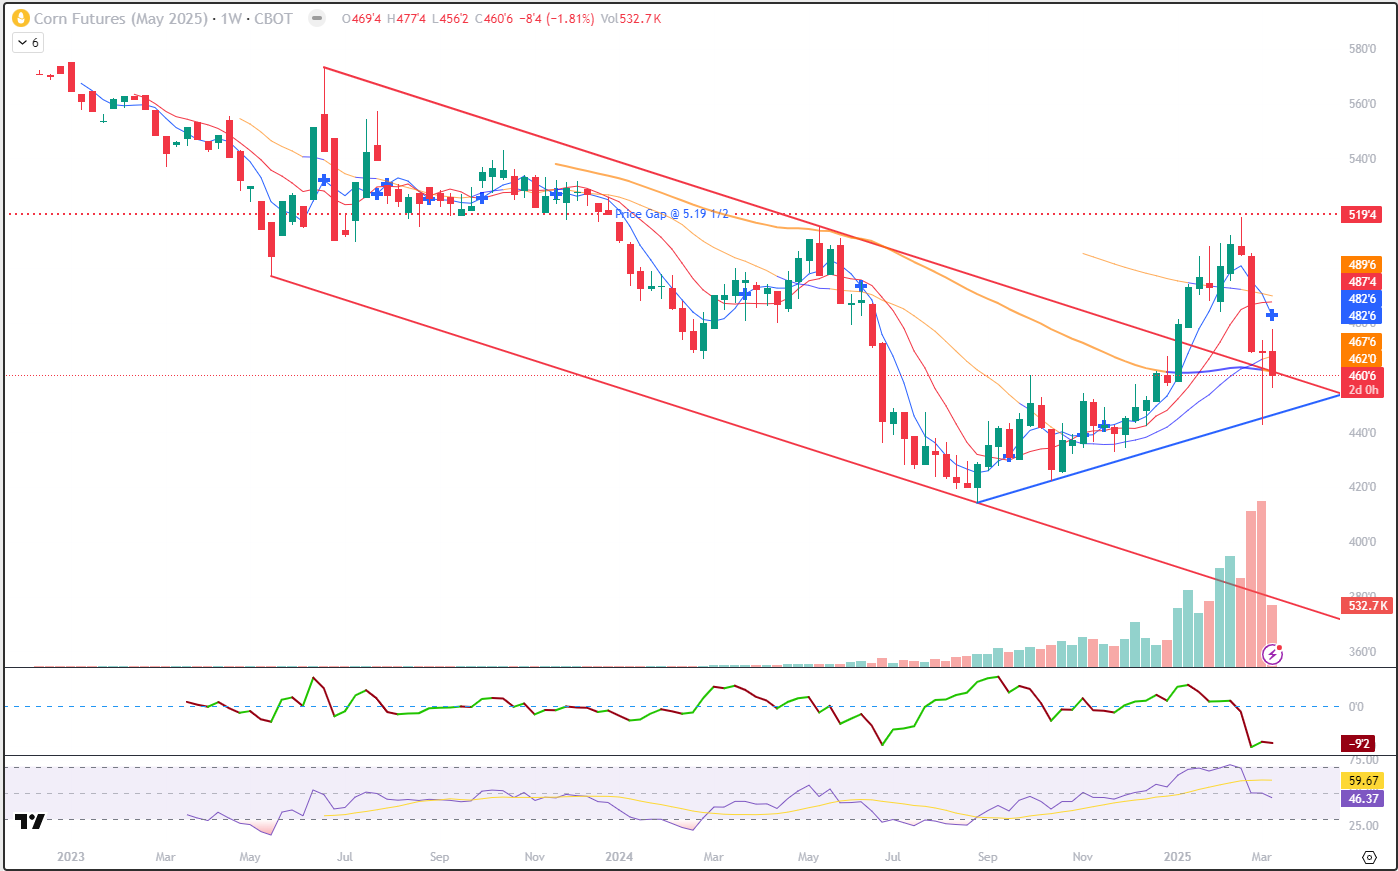
For the past 4 weeks, this market has been on the defensive, since it failed to fill the gap near 5.19 ½. However, last week’s trade saw a spike down to 4.42 ½ before closing the week at 4.69 ¼, only ½ a cent lower than where it started on Sunday night. Usually, I think a bar like that indicates a point of indecision or equilibrium in the market. Bears had a chance to push prices lower, Bulls had a chance to rally the market, nobody could win so the market reverted back to where it started. You’ll notice the blue trendline support, drawn off of the lows from last August and October, held nicely, so far. And the red trendline, drawn off of the June ‘23 and May ’24 highs also held as support last week, with the market closing above that. This week, May Corn is down 8 ½ cents, testing that trendline again. If you see that blue cross above the current bar, that indicates a bearish crossover (sell side) of the 5- and 10-week moving averages. Looking back over the chart, there have been a few instances of those crossovers getting whipsawed, or reversed, within a week or two. Corn settled today below almost all of the moving averages on my chart and those levels may offer some technical resistance. The closest average is the 50-week, at 4.62 (tough to see, orange, buried in with a red trendline and this week’s red bar), next is the 20-week at 4.67 ¾, which is orange now as it’s above the price, was blue) Those are followed by the 5-week (blue 4.82 ¾), the 10-week (red, 4.87 ½) and the 100-week at 4.89 ¾ (orange, as well) Currently, the 14 bar Forecast oscillator and the 14 period RSI at the bottom of the chart are pointing down. If you are bullish this market, I’d consider buying Call options. For example, May 5.00 Calls settled today at 3 ½ cents, or $175 before commissions and fees. I think those might have good upside potential, without much financial risk. The time value will be a factor, but I like the potential because the at-the-money 4.60 calls closed at 15 ½ today, or $775. I think that that’s a pretty good risk/reward ratio. They expire in 44 days. If you’re bearish, and an aggressive and well-margined trader, consider a short futures position targeting 4.40 or lower, with a risk/reverse stop above last week’s high which was 4.73 ½. Keep in mind that 4.40 would put prices below last week’s low, adding to the bearish fuel.
May Corn (Seasonal)
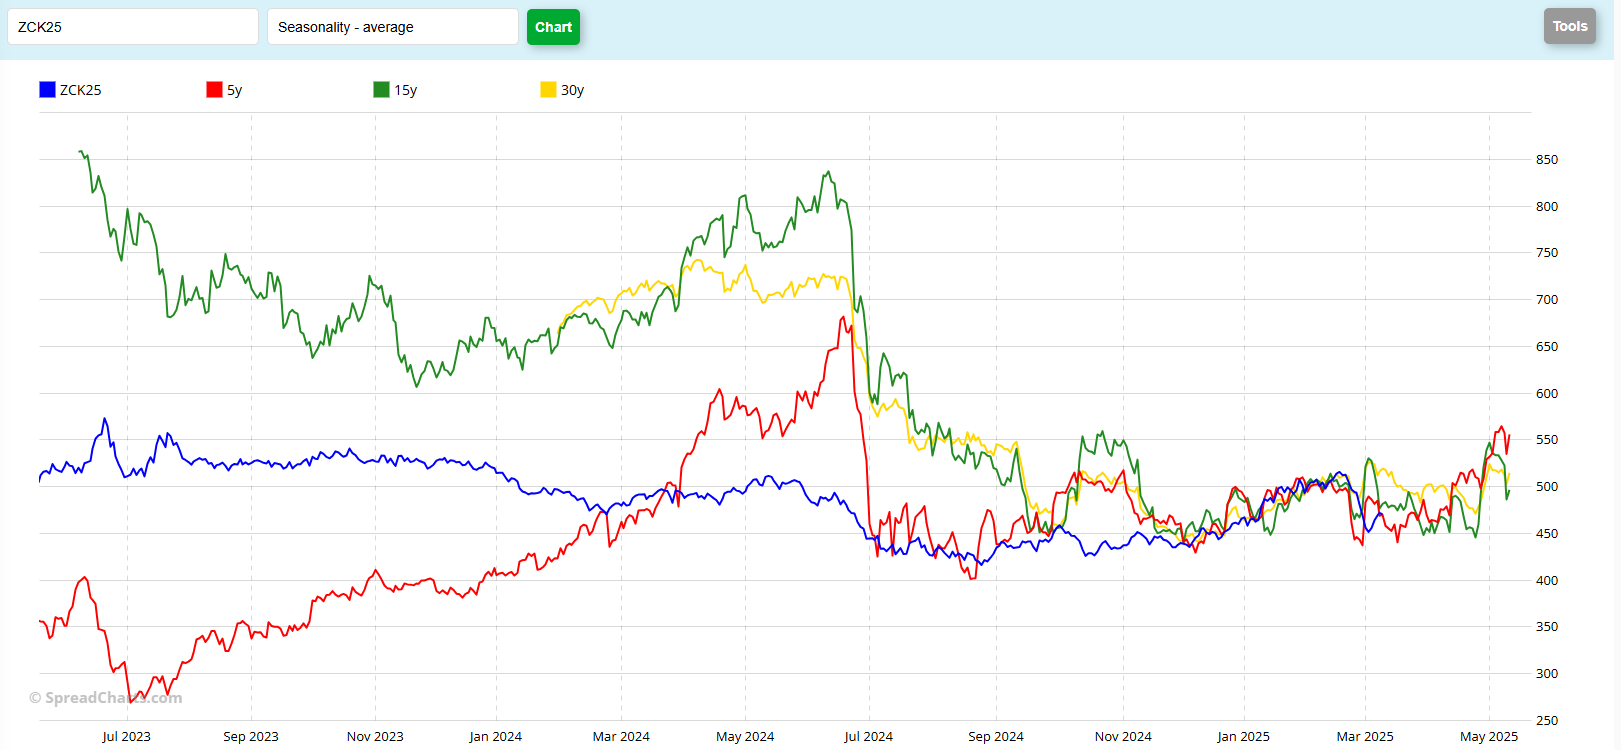
With this seasonal chart, I’ve gone back 2 years, rather than the 1 year that you’ll normally see here. The reason that I’ve done that is to give you a picture of how out of sync this market has been until relatively recently. To my eye, the current contract hasn’t really matched up, so to speak, until roughly the beginning of December. I think that you’ll notice that this contract seems to have been behaving very differently than the historicals indicate, and even that may just be a timely coincidence over the past few months. Looking forward, it seems as if the May contract has typically been reluctant to get much below 4.50. No doubt it’s a choppy forecast, but generally May Corn trends higher until expiry.
Jefferson Fosse Walsh Trading
Direct 312 957 8248 Toll Free 800 556 9411
jfosse@walshtrading.com www.walshtrading.com
Walsh Trading, Inc. is registered as a Guaranteed Introducing Broker with the Commodity Futures Trading Commission and an NFA Member.
Futures and options trading involves substantial risk and is not suitable for all investors. Therefore, individuals should carefully consider their financial condition in deciding whether to trade. Option traders should be aware that the exercise of a long option will result in a futures position. The valuation of futures and options may fluctuate, and as a result, clients may lose more than their original investment. The information contained on this site is the opinion of the writer or was obtained from sources cited within the commentary. The impact on market prices due to seasonal or market cycles and current news events may already be reflected in market prices. PAST PERFORMANCE IS NOT NECESSARILY INDICATIVE OF FUTURE RESULTS. All information, communications, publications, and reports, including this specific material, used and distributed by Walsh Trading, Inc. (“WTI”) shall be construed as a solicitation for entering into a derivatives transaction. WTI does not distribute research reports, employ research analysts, or maintain a research department as defined in CFTC Regulation 1.71.