
The information and opinions expressed below are based on my analysis of price behavior and chart activity
May Corn (Daily)
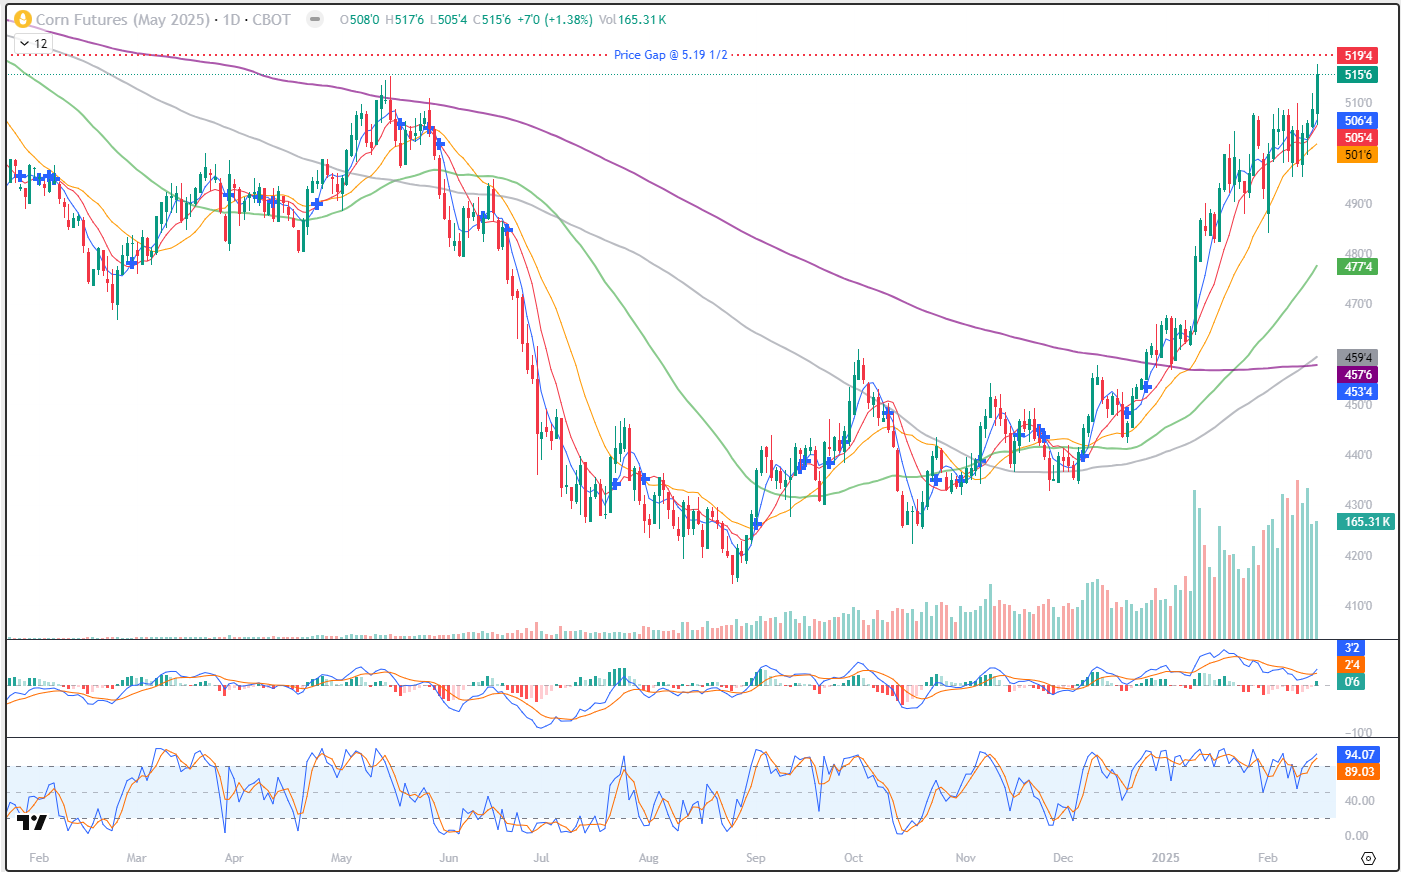
May Corn closed at 5.15 ¾ today, up 7 cents since Friday’s close. Today’s trade took out the congestion/consolidation space that’s been building over the 2-3 weeks and would indicate the beginning of another bullish push for Corn prices, to my eye. May Corn hasn’t closed this high since Dec 29th of 2023, the last trading day of that year. Looking back to that point in time, it also started 2024 by gapping down on the first trading day of the year. That gap is at 5.19 ½ on the May chart, and I’m of the opinion that futures markets hate gaps and will likely (and eventually) fill them in. Perhaps not always or every time there’s a gap, but more often than not, gaps get filled. Sometimes it may take a long while, like this one, to be filled. But I’m getting a little ahead of myself, as that gap has not yet been filled. The MACD indicator (1st sub-graph) crossed back into bullish territory today, since crossing into slightly bearish (less bullish, perhaps?) during the 2nd half of January. Stochastics, just below that, hooked back up into an overbought reading, but they’ve been that way, for the most part, since Christmas. Support might be found near Friday’s high, at 5.12, or down to the round number of 5.10. The 5-day moving average is near 5.06 1/2, and the 10-day is at 5.05 1/2. (those moving averages came thisclose to changing to bearish territory, but did not make that crossover. The March contract did last week, before flipping back to bullish side today) The May 15th high of 5.15 ¼, may also offer support, but that’s very close to the market. Overhead resistance on the daily chart may be found near today’s high (5.17 ¾) but I think the next target is going to be 5.20. That would fill the gap on the chart and give the bears out there a reason to sell. If you’re a producer and still have unpriced bushels in the bin, that 5.20 mark might be a good level to let go of some of your grain. There’s a further level of resistance near the 5.25-5.30 level, a place where prices consolidated for the last 2 months of 2023. COT data, released Friday, indicates that while they did lighten up their positions a little last week, managed money (funds) are still very much on the long side of the market. Export Inspections, released today, totaled 1.61 MMT. I’m not certain if this is new demand or just other countries trying to get ahead of potential tariffs. Either way, demand for Corn right now seems strong. Aggressive and well-margined traders may do well to consider long positions in futures, if there’s a pull back to support. Perhaps a risk/reverse, or flattening sell-stop, below last weeks double-low of 4.95 ¼ would be wise. Less aggressive producers may do well to consider long Call option positions, replacing bushels that may have been sold. The Corn trend is up and it is currently strong. The 100- and 200-day averages crossed into bullish trade last week, (grey/purple) following the bullish crossover of the 50- and 200-day averages last month (green/purple) Both of those are typically long-term trend measurements and are bullish.
May Corn (Weekly)
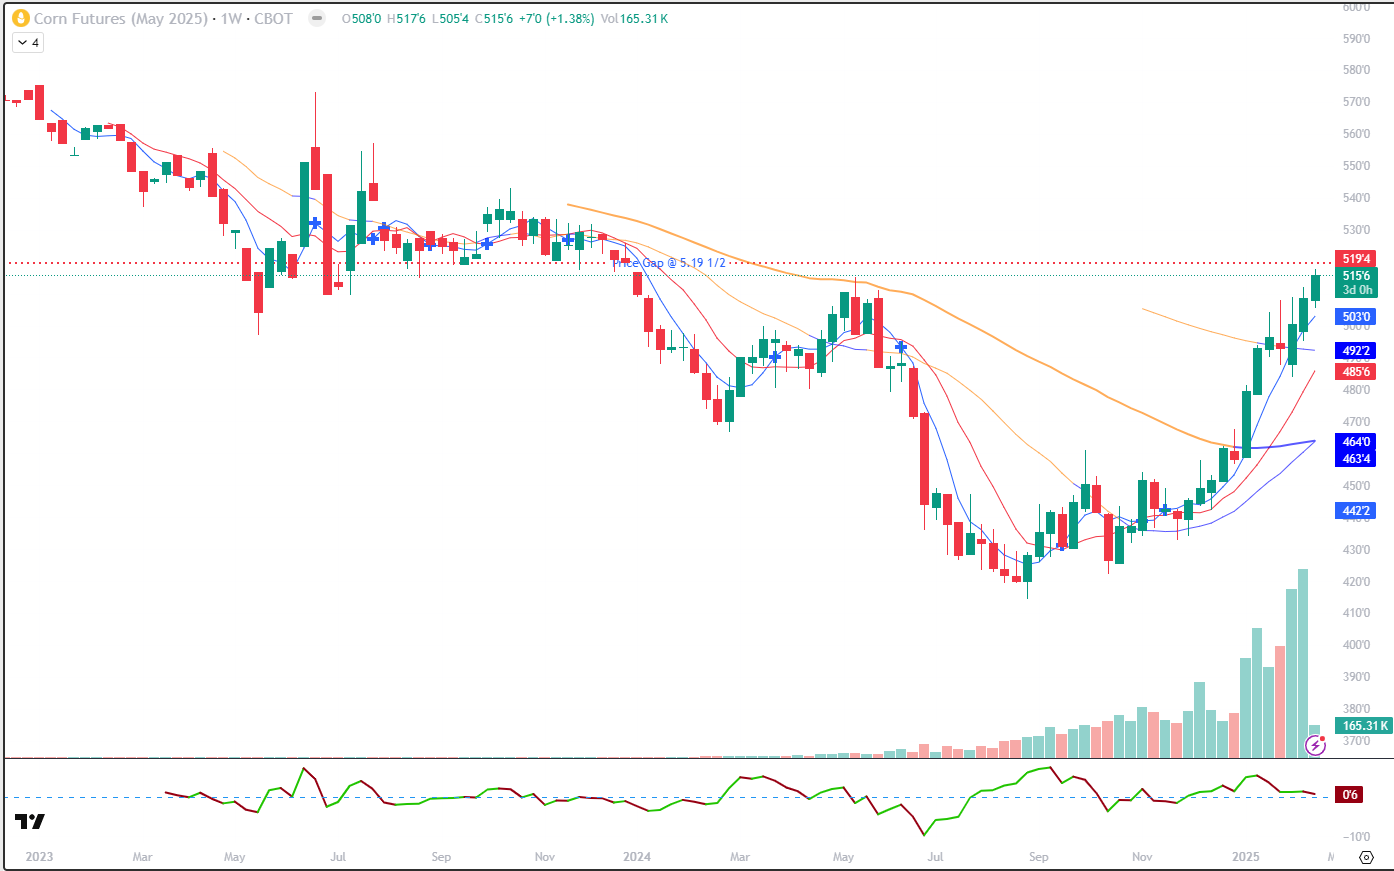
The weekly chart for May Corn appears to be in a strong trend up. This chart goes all the way through the life of the contract and has been moving higher since making the lows during the last week in August. The 5- and 10-week averages (blue/red) crossed to the bullish side on this weekly chart in the 3rd week of November. Momentum seems strong, with today’s gains nearly equaling the gains made last week. Support might be found near last week’s high of 5.12 and then down to the 5-week moving average at 5.03. 5.00 (nice big, round even number) would seem likely support, as well. The 100-week average is at 4.92 ¼. While that would seem like reasonable support, a 20+ cent drop in prices to that level, might change a few minds about being bullish. Resistance might be found near 5.19 ½, which is a gap left on the chart for over a year. The last week in December of 2023 was when May Corn traded there last. Beyond that, 5.25 is the next nice, big, fat number to target, or the October 2023 high near 5.43. That might seem like an aggressive target, but that’s only about 30 cents away from here. It’s taken just six weeks for prices to add 30 cents (4.85 in the 2nd week of January) and if this market starts to attract more bullish interest, it may not take that long to get up there. Also of note, the 20-week and 50-week moving averages are very close to a bullish crossover. You’ll see those denoted in blue, at 4.64 and 4.63 ½.
May Corn (Seasonal)
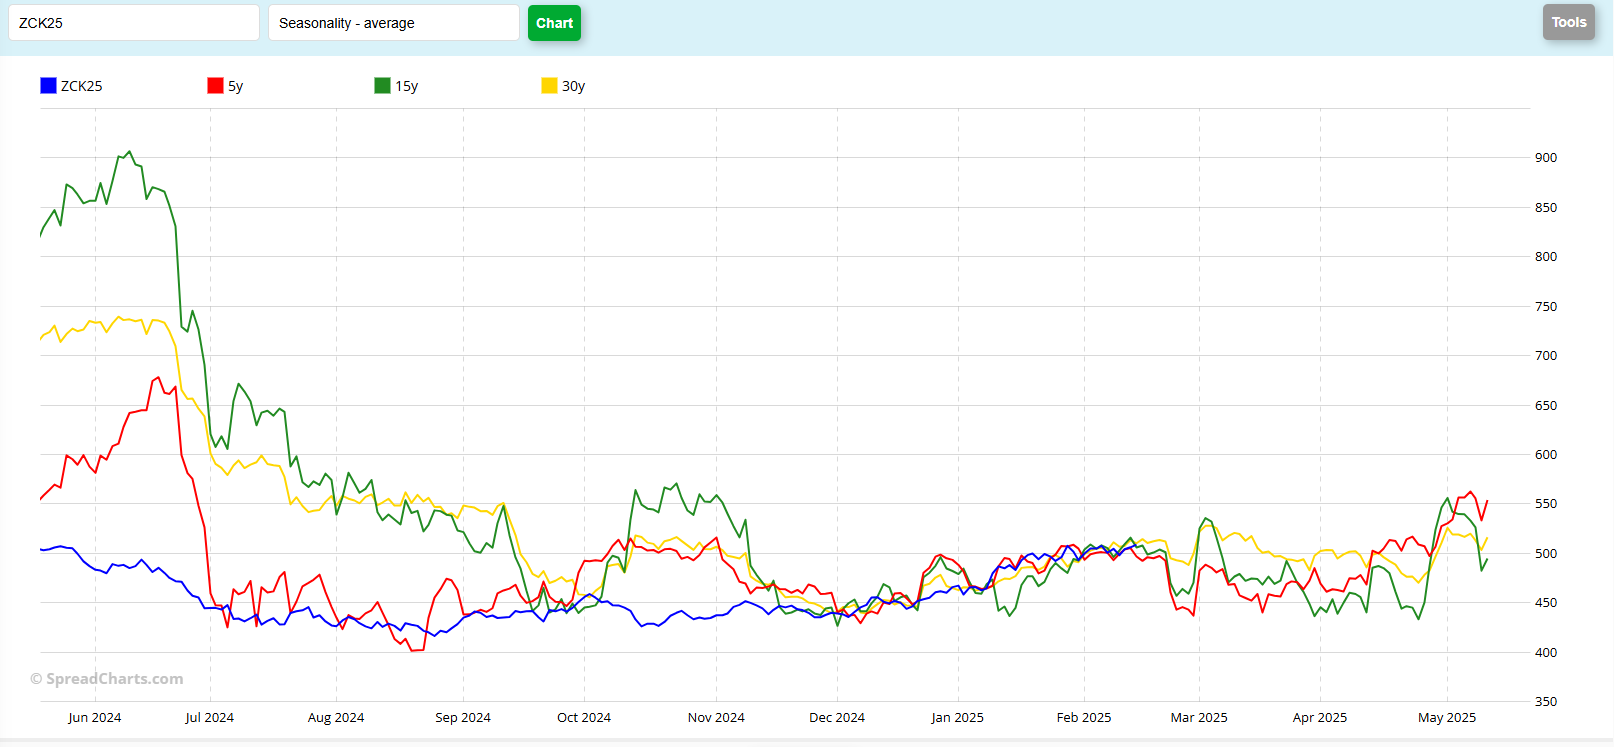
The Seasonal chart for May Corn isn’t offering any dramatic clues, in my opinion. They do suggest a 50 cent rally, but will it come from current price levels or from lower prices next month? First off, May Corn appears to have been holding to the seasonal patterns since about mid-November. There seems to be a bit less volatility in the current contract that the historical record indicates. For example, there was no peak-to-valley move in Dec-Jan, like we’ve seen in years past. It seems to have been more of a slow, steady move higher, in my opinion. Looking forward, the historicals suggest some price pressure when the March contract hits First Notice Day. Contract rollover has already begun, as the open interest in May now exceeds the March. The 5-year (red), 15-year (green) and 30-year (yellow) indicate potential weakness through the end of March, before a rally into the May contract expiration. The last couple of years have been odd for seasonals, especially in markets that have seen extreme swings from lows (Covid) to highs (war) to lows (neither of those) over the past 5 years. The trend over the past 3-4 months has been up. Will that be enough to break away from the seasonal tendencies?
Jefferson Fosse Walsh Trading
Direct 312 957 8248 Toll Free 800 556 9411
[email protected] www.walshtrading.com
Walsh Trading, Inc. is registered as a Guaranteed Introducing Broker with the Commodity Futures Trading Commission and an NFA Member.
Futures and options trading involves substantial risk and is not suitable for all investors. Therefore, individuals should carefully consider their financial condition in deciding whether to trade. Option traders should be aware that the exercise of a long option will result in a futures position. The valuation of futures and options may fluctuate, and as a result, clients may lose more than their original investment. The information contained on this site is the opinion of the writer or was obtained from sources cited within the commentary. The impact on market prices due to seasonal or market cycles and current news events may already be reflected in market prices. PAST PERFORMANCE IS NOT NECESSARILY INDICATIVE OF FUTURE RESULTS. All information, communications, publications, and reports, including this specific material, used and distributed by Walsh Trading, Inc. (“WTI”) shall be construed as a solicitation for entering into a derivatives transaction. WTI does not distribute research reports, employ research analysts, or maintain a research department as defined in CFTC Regulation 1.71.