The information and opinions expressed below are based on my analysis of price behavior and chart activity
March Soybeans

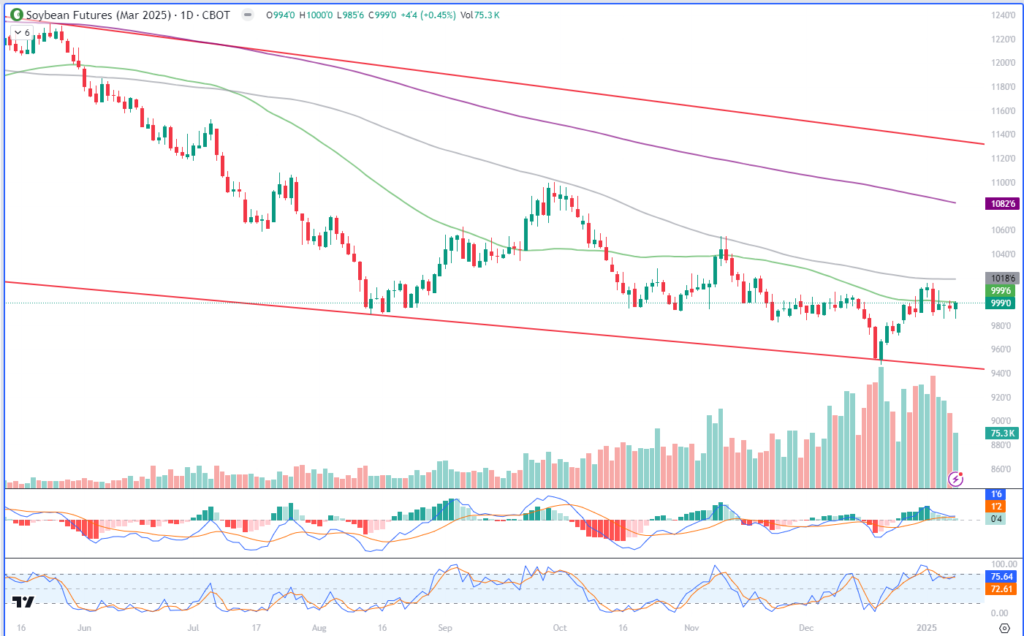
March Soybeans closed up 4 ½ cent today, settling at 9.99. Tomorrow at 11 AM will be the January WASDE release. Typically, this report adds volatility to the market and is one that is widely watched and traded. I’ve included a seasonal chart below, so you can see how it has historically reacted. Price really haven’t gone anywhere since the day after Christmas. Dec. 26th March closed at 997 ¼. We saw a New Year’s Eve rally push Beans over 10.00, but 2 trading days later the close was at 9.91. The big, round number of 10.00 seems pretty important. It was today’s high and has been a tough number for the market to clear. We’ve only seen the market close above that level on 5 days since the week before Thanksgiving. Coincidentally, the 50-day moving average is at 9.99 ¾, as well, offering potential resistance to traders. Support levels might be near Tuesday’s low of 9.85 1/2, or the Dec. 26th low of 9.81. In addition to the 50-day average at 9.99 ¾, the 100-day is at 10.18 ¾ and the 200-day is at 10.82 ¾. There may be some additional levels near the November high of 10.55. The chart does seem primed for a rally, to my eye, but Soybean prices have been declining for over two years now. Take a look a 10-year weekly chart…
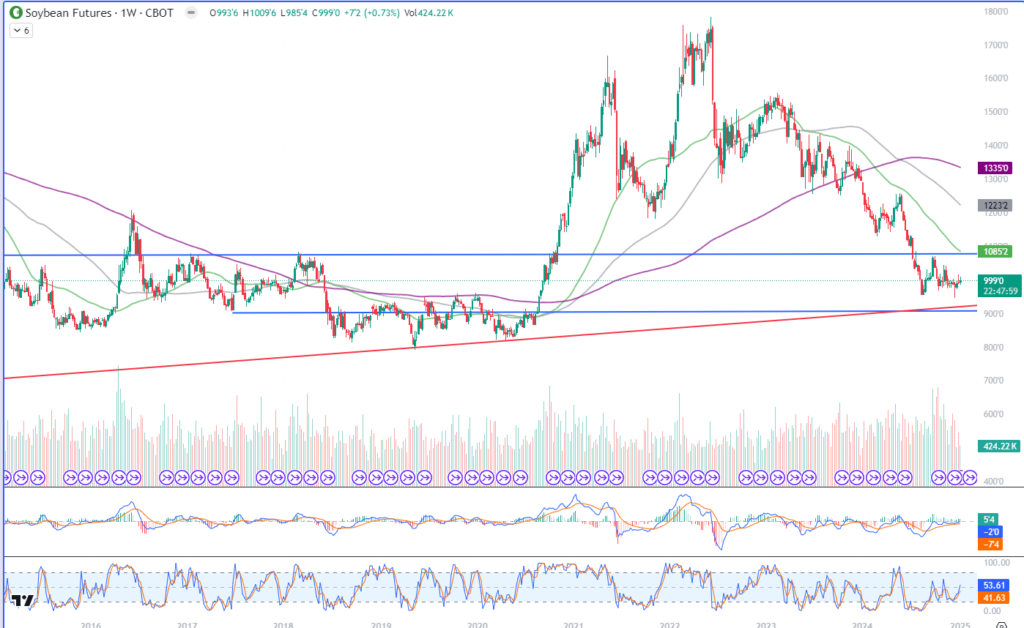
Soybeans (front month, continuous, weekly chart, 10 years)

There may still be some downside ahead. That red line is drawn off the lows posted in Jan 2002 to April 2020. Today that trendline value is roughly 9.20. Soybean producers will be hurting, I think, if we trade that far down. But that’s where I see potential support, if the market can’t vault above 10.00. The horizontal blue lines roughly represent the range from 2014-2018. I drew the top one when I was looking for potential support levels as the market came down from the 2022 highs. That support level did NOT hold and eventually showed to be resistance this past fall. The next one down is drawn off the 2017 lows and is located near 9.10 or so. South American production will offer some serious competition and the current estimates coming out of Brazil are not bullish at this time. It might get hot. And maybe a little dry from time to time. But it’s summer there and that’s what summer does. The acreage planted is near the 117 million mark and that could mean a crop size over 6.1 billion bushels, up from their record of 5.67 billion in 22/23. If the weather is cooperative down there, or even gets better, that could spell trouble for our exports and prices in 2025. And we haven’t even gotten to the US production season yet. Strength in the US Dollar also may offer some headwinds to prices, as that can force other countries to reduce their purchases, as they won’t be getting the proverbial “bang for their buck.” Currently, our US export shipments are running about 23% ahead of last years pace, which is good. We need that to continue, or even pick up pace, if prices are to meaningfully jump.
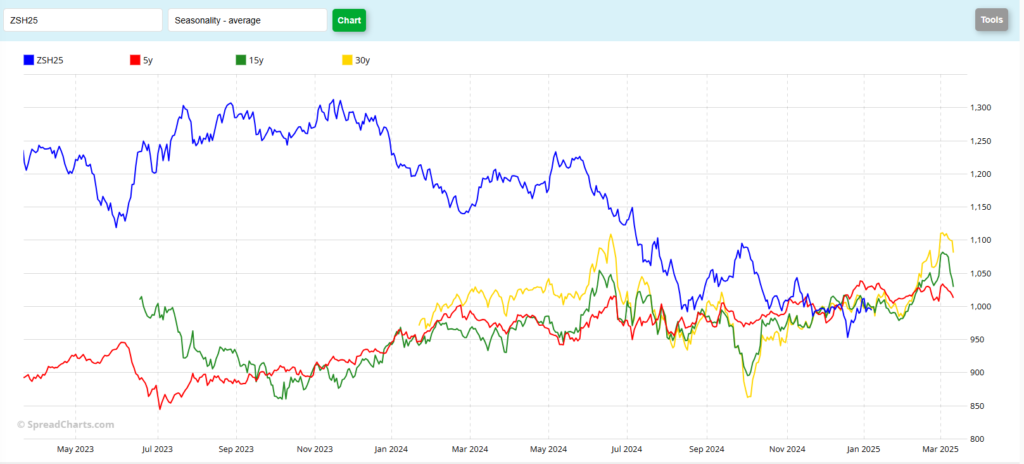
March Soybeans Seasonal

Seasonally, the market seems to typically get a bearish reaction. Maybe not on report day, buy usually within the next week to 10 days. At least that’s what I glean from the chart just above. However, the seasonals haven’t really meant much to the Soybean market, to my eye. The 5-year pattern says we don’t begin rally until about Jan. 24th, with the 15- and 30-year at Jan 30th and Feb. 3rd, respectively. But looking over this picture, the seasonals don’t currently matter for Soybeans.
Jefferson Fosse Walsh Trading
Direct 312 957 8248 Toll Free 800 556 9411
jfosse@walshtrading.com www.walshtrading.com
Walsh Trading, Inc. is registered as a Guaranteed Introducing Broker with the Commodity Futures Trading Commission and an NFA Member.
Futures and options trading involves substantial risk and is not suitable for all investors. Therefore, individuals should carefully consider their financial condition in deciding whether to trade. Option traders should be aware that the exercise of a long option will result in a futures position. The valuation of futures and options may fluctuate, and as a result, clients may lose more than their original investment. The information contained on this site is the opinion of the writer or was obtained from sources cited within the commentary. The impact on market prices due to seasonal or market cycles and current news events may already be reflected in market prices. PAST PERFORMANCE IS NOT NECESSARILY INDICATIVE OF FUTURE RESULTS. All information, communications, publications, and reports, including this specific material, used and distributed by Walsh Trading, Inc. (“WTI”) shall be construed as a solicitation for entering into a derivatives transaction. WTI does not distribute research reports, employ research analysts, or maintain a research department as defined in CFTC Regulation 1.71.
