The information and opinions expressed below are based on my analysis of price behavior and chart activity
March Soybeans

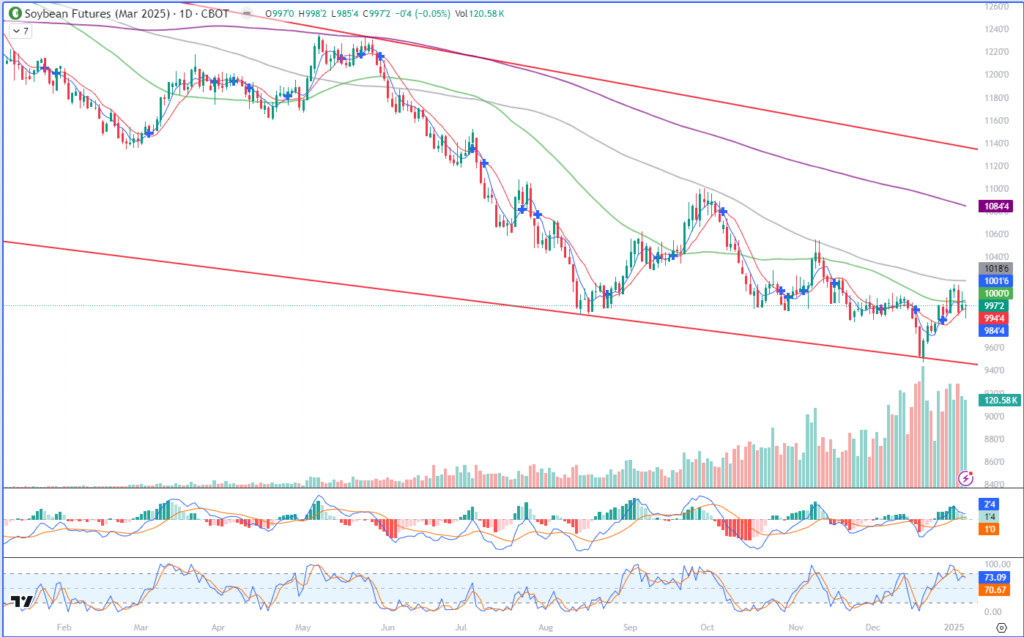
March Soybeans closed down ½ cent today, settling at 997 1/4. Trade did dip below the 10-day moving average during the overnight trade (994 ½) but buyers resurfaced after the day session opened and the market worked up off the low of 985 1/2 all morning long, before going sideways for the last hour or so of trade. Friday at 11 AM the USDA will release their “final” WASDE report for the crops just harvested, along with Quarterly Grain Stocks. Regardless of what you or I may think the USDA might say, this report can move the market more than most government Ag reports do. By looking at the chart above, you may notice that the Bean market has been in a downtrend all year long. We did see the market bounce somewhat aggressively from the contract low, established last month, at 947. Coincidentally, that level also matched up pretty well with the long-term trend support (lower red horizonal) that was drawn off of the May ’23 and August ’24 lows. So since we set contract lows and hit trend support, Bean prices rallied some 68 cents, or so, to last Thursday’s high of 1015 ¾. We’ve since settled back under the 10.00 mark, putting the market under both that big, fat, round number and the 50-day moving average (also, coincidentally, at 10.00 today) That number will offer some key psychological resistance (or support if the market can close above it) in my opinion. The 10-day moving average is below the market at 994, but the 5-day is up at 1001 ¾, and the 100-day is at 1018 ¾ with the 200-day all the way up at 1084 ½. Today’s activity was perhaps more neutral, as the market opened and closed at nearly the same price today. Bears had a chance, couldn’t break it. Bulls had a chance, couldn’t rally it. So we came back to where we started. Those that are familiar with Candlestick chart will recognize that as a Doji. I also call days like this “equilibrium days” as we seem to have (very temporarily) found a point of price balance. Normally, I would suggest bracketing a market like this with stop orders. Buy stops above the range and sell stops below the range would serve as entry points. In other words, if the market breaks higher, buy it. If it breaks lower, then sell it. However, with the WASDE later this week, it may not be a wise strategy, as I’m concerned with immediate volatility following the release at 11 on Friday. From a current supply/demand view, I think that demand is decent. It’s not great and wildly bullish, but we are seeing shipments roughly 23% ahead of last year’s pace. That’s pretty much the extent of the bullish news. South American crops are progressing well, but we’ll keep an eye on the weather. I have heard some concerns that the USDA will raise ending stocks by quite a bit over the current estimate of 470 million bushels. If those concerns turn out to be valid, we could very easily see this market drop to the old lows near 950, if not further. There is also uncertainty regarding the “Trump tariffs” which I’m sure we’ll get some clarity on following his inauguration. The last time he was in office, if I recall correctly, trade wars took a good 20-30% out of prices, before rallying to the stratosphere. (remember the 1332 ½ contract high? It was in Dec of ‘22)
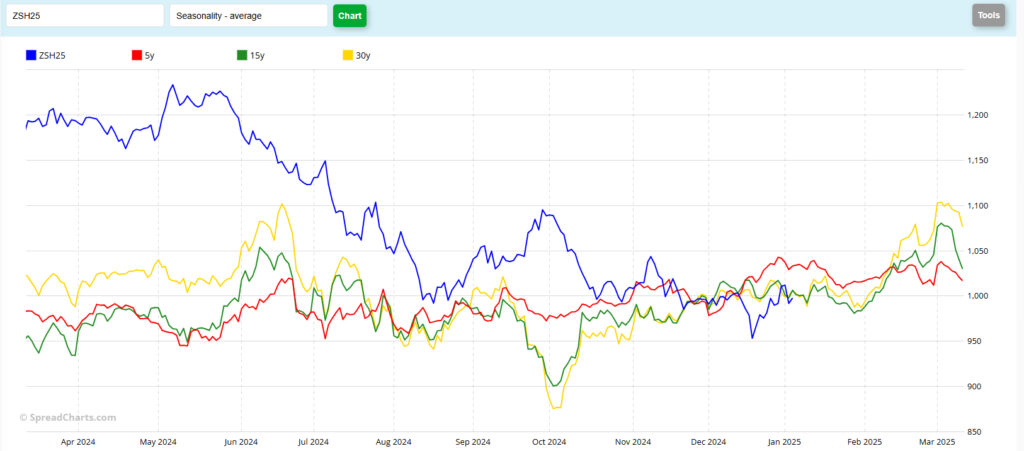
There is a seasonal chart below. To my eye, Beans generally go sideways to lower In January, following a slight bounce from the Jan WASDE and then trend higher through most of February.

Jefferson Fosse Walsh Trading
Direct 312 957 8248 Toll Free 800 556 9411
jfosse@walshtrading.com www.walshtrading.com
Walsh Trading, Inc. is registered as a Guaranteed Introducing Broker with the Commodity Futures Trading Commission and an NFA Member.
Futures and options trading involves substantial risk and is not suitable for all investors. Therefore, individuals should carefully consider their financial condition in deciding whether to trade. Option traders should be aware that the exercise of a long option will result in a futures position. The valuation of futures and options may fluctuate, and as a result, clients may lose more than their original investment. The information contained on this site is the opinion of the writer or was obtained from sources cited within the commentary. The impact on market prices due to seasonal or market cycles and current news events may already be reflected in market prices. PAST PERFORMANCE IS NOT NECESSARILY INDICATIVE OF FUTURE RESULTS. All information, communications, publications, and reports, including this specific material, used and distributed by Walsh Trading, Inc. (“WTI”) shall be construed as a solicitation for entering into a derivatives transaction. WTI does not distribute research reports, employ research analysts, or maintain a research department as defined in CFTC Regulation 1.71.
