The information and opinions expressed below are based on my analysis of price behavior and chart activity
March Soybeans

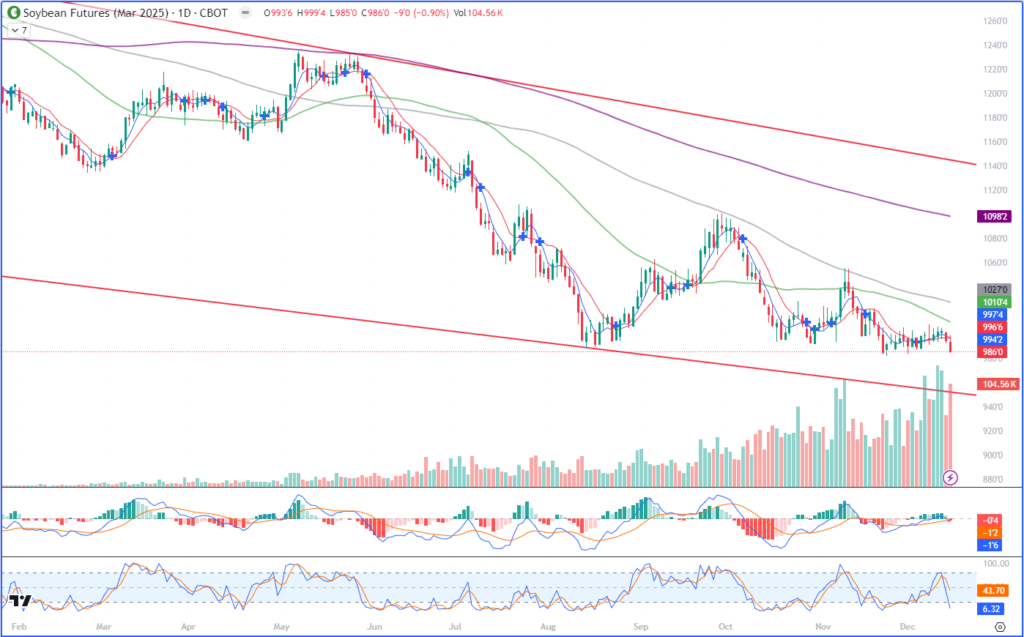
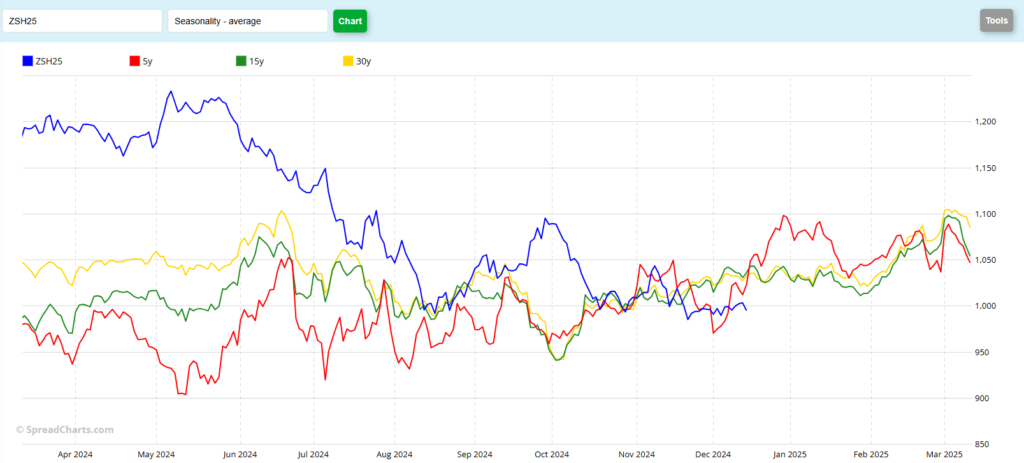
Open Interest has shifted to the March contracts in the Soy complex. January is still leading, as far as volume goes, but that will change in the coming days. Today, the March contract dropped 9 cents, to close at 9.86. The contract low close was on Nov 21st at 9.85 ¼ and the contract low was posted the next day at 9.82 ½. This seems like a very weak close, to my eye. Soybeans have been in a downtrend all year long and they don’t currently show any sign of wanting to reverse that. Export Inspections that came out today at 10 AM show 25.2 million metric tons of Beans have been readied for export. That’s actually an improvement of about 4 mmt over last year’s pace. I would normally expect that to be bullish, but the market currently does not agree. Traders seem to be focused more on South American weather, as planting wrapped up and the bulk of the growing season approaches. On balance, most are currently expecting Brazil to have a harvest close to 170 mmt. By way of comparison, the US production is just north of 116 mmt. (4,270,000 bu x 0.0272155 conversion factor) That’s definitely not bullish for Bean prices, in my opinion. Soy market participants are also looking sideways at the “Trump Tariffs” To my mind, he’s not president yet and can’t really set any policies until he is. Everything until then is just noise. The noise can be effective sometimes, as we’ve seen some world leaders seem to shift their positions or policies recently, as a direct result of Trump statements and/or hints. Seasonally, (chart below) March Soybeans tend to rally into expiration, although it’s not usually a “bullish” rally until the end of January or so. In fact, I think that if you take out the last 5 years (COVID, Russia/Ukraine war), which I think were an aberration, Soybeans typically go more sideways until the end of January. Look at the Green and Yellow lines on the Seasonal chart to see if you agree. I think you’ll notice that the bulk of trade in 2024 did not hold to the “usual” seasonal trade. Currently, I’m a bit skeptical they’ll be able to stick to this pattern, as we are coming out of an extended period of unusual prices. Trend line support (red horizontals) would be found near the 9.52 level today, with the expectation that will continue to decline as we move forward through time. The contract low at 9.82 ½ may offer some support, but following today’s trade, there appears to be too much bearish momentum for that to hold.
March Soybeans (Seasonal pattern)

So where do Soybean prices go from here? Producers should still be protected on any unsold or unpriced bushels. Keep in mind that the most recent WASDE saw the USDA lower the average expected farm price from 10.80 in November to 10.20 last week. That’s a HUGE departure from the 22/23 price of 14.20 and the 23/24 price of 12.40. Hopefully, readers here were sufficiently hedged against that. I fully expect the March Beans to set new contract lows and continue marching toward the 9.50 mark. March Put options expire in 67 days. A 9.50 Put closed at 13 3/8 today, or $668.75, plus commissions and fees. For those of you that have no downside protection on Beans you still own, that may be a good fit. Resistance overhead may be found near the 5- and 10-day moving averages, or 9.94 ¼ and 9.96 ¾, respectively. The 50-day at 10.10 ½ would seem like a resistance target from here but the market still needs to get through the 10.00 (big, fat, round number) mark first. In fact, the past 6 trading days (not today) the March contract flirted with 10.00 everyday, but was unable to break through on a close. Aggressive and well-margined traders may do well to consider short positions. The Stochastic indicator (bottom subgraph) is currently pointing lower, after failing to get to overbought status last week. The MACD indicator, just above that, hooked over to the “sell side” on my chart today. Unless the market opens significantly higher tonight. I would expect the 5- and 10-day moving averages to switch to bearish territory with tomorrow’s trade, as well. A downside target could be the 9.50-ish trendline level, but you may be better served to take profits in 20 cent increments, should those accrue. Volume was fairly strong today, indicating more selling pressure to my eye. Especially since the higher volume days that we saw last Wednesday and Thursday did not result in higher prices.
Jefferson Fosse Walsh Trading
Direct 312 957 8248 Toll Free 800 556 9411
jfosse@walshtrading.com www.walshtrading.com
Walsh Trading, Inc. is registered as a Guaranteed Introducing Broker with the Commodity Futures Trading Commission and an NFA Member.
Futures and options trading involves substantial risk and is not suitable for all investors. Therefore, individuals should carefully consider their financial condition in deciding whether to trade. Option traders should be aware that the exercise of a long option will result in a futures position. The valuation of futures and options may fluctuate, and as a result, clients may lose more than their original investment. The information contained on this site is the opinion of the writer or was obtained from sources cited within the commentary. The impact on market prices due to seasonal or market cycles and current news events may already be reflected in market prices. PAST PERFORMANCE IS NOT NECESSARILY INDICATIVE OF FUTURE RESULTS. All information, communications, publications, and reports, including this specific material, used and distributed by Walsh Trading, Inc. (“WTI”) shall be construed as a solicitation for entering into a derivatives transaction. WTI does not distribute research reports, employ research analysts, or maintain a research department as defined in CFTC Regulation 1.71.
