The information and opinions expressed below are based on my analysis of price behavior and chart activity
March Feeder Cattle

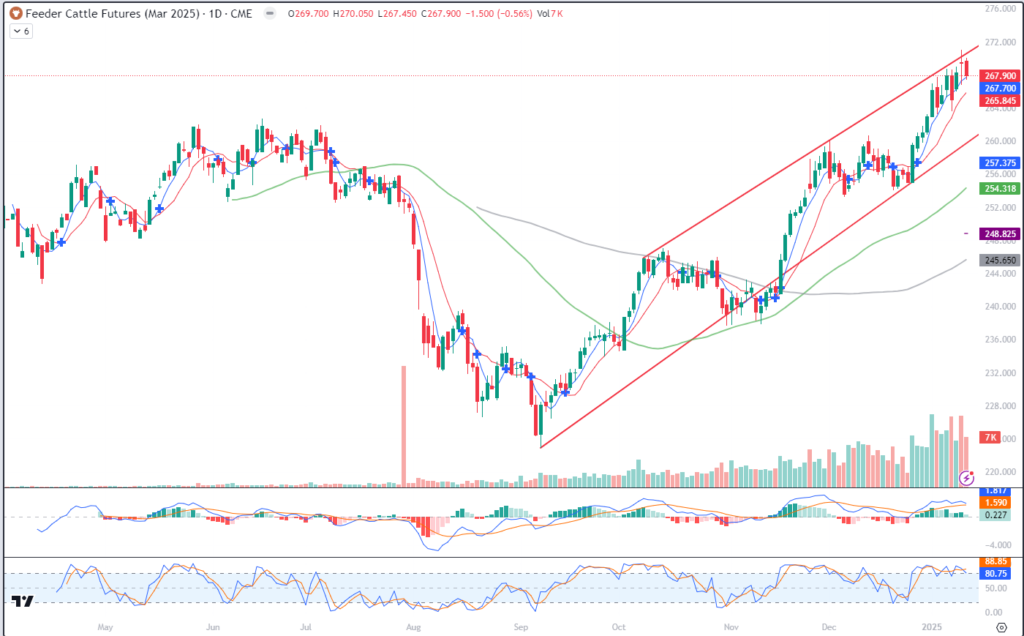
March Feeder started off this week by dropping 1.50 to close at 267.90. Last week my news feed (and still some today) was talking about record-high cattle prices. There’s no mistake, cash cattle prices ARE historically high. Can they keep going up? My short answer is yes, until the US beef consumer decides that grocery store prices are too high to pay. The long answer is likely more complicated and not nearly as clear. Slaughter weights are up ( I know, I’m talking about the wrong cattle contract here) and those higher weights are about the only way to make money on the live animals right now. I would urge you to look at some of these record prices and calculate what the breakevens might be on those sold animals. To my eye, profit margins are already razor-thin and these really high feeder prices don’t easily pencil in the black. I think that may get a little harder, given that Corn prices are back up near the 4.75 level, over 70 cents from the August 26th low. There is some sense of “irrational exuberance,” to borrow a phrase, but as long as someone is willing to pay these current prices for feeder cattle, regardless of current profitability, this exuberance in the cash market will continue, I think. But what does the chart say? Feeder Cattle made a low on Sept. 9th at 222.900. Since then, prices have rallied nearly 50.00 (48.10, to be precise, using this past Friday’s high) without any meaningful pullback. Yes, following the October high, prices did retrace about 38% of the move, but as I look back with the benefit of hindsight, it appears to my eye that it was more of a sideways move than anything else. A similar thing happened following the early December high….the market went sideways and didn’t really sell-off at all. You’ll notice that I’ve drawn an ascending price channel on the chart above. I’ve drawn the high side off of the Oct 8th and Dec 2nd highs, with the low end drawn off the Sept low and Dec 26th low. Unintentionally, that also (roughly) corresponds with the consolidation level that followed the 3-day selloff at the very end of October. Even as people were clamoring about the record highs last week, prices didn’t really test that upper resistance level in that channel until this past Friday. Friday we saw a fairly large trading range, but did not get a directional close, in my opinion. While not a textbook Doji (opening and closing at the exact same price) I will call Friday’s trade “close enough for government work” as we opened at 269.525 and closed at 269.400. IF we see the market close outside of Friday’s range (271.000-266.775), to my mind, that should se the next directional push. In other words, if the market closes above the 271.000 level, I would expect another push higher to come shortly after that. Conversely, if the March Feeders close below 266.775, I would expect more selling pressure to appear. Out of the 8 trading days we’ve had in 2025, 4 days have been bullish, 4 bearish. Noticeably, with the exception of Jan 2nd, the trading volume on the down days has been higher than the up days. That tells me that traders are more willing to sell at these high prices, whether from a profit-taking or hedging point-of-view.
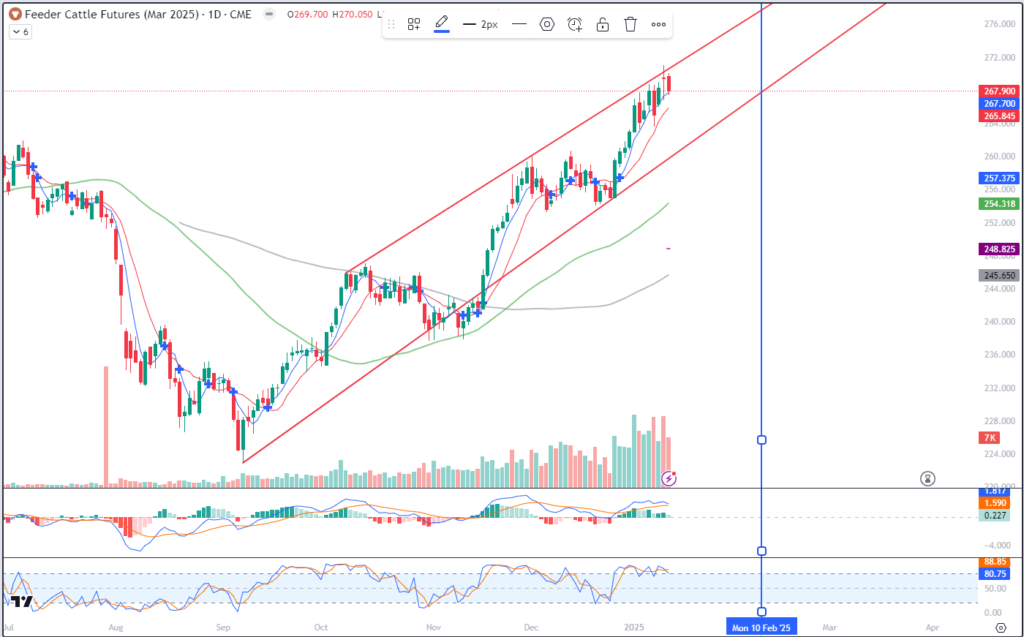
By looking at the chart, you’ll notice that it is relatively overbought. Stochastics are in the lower sub-graph and they’ve indicated that condition since Dec 26th. However, as you’ll notice by looking back in time, overbought does NOT have to mean lower prices. After all, Feeders were overbought for the last half of November. They “cured” that condition not by selling off, but by going sideways for most of December. You’ll also notice that the price rally started in late Dec when prices intersected with the lower trend channel. I’ve added another chart below so you can see that IF the market goes sideways from here, instead of trending up/down, the lower trend channel intersects with today’s price on or about Feb 10th. (the high end on that same date is around 277.750)

There is resistance, I think, near Friday’s high at 271.00, which also corresponds with that upper channel line. Beyond that, I would look for round numbers, so to speak, like 275.00. Support might be found near the 5-day moving average (blue) at 267.700, Friday’s low at 266.775 and the 10-day moving average (red) at 265.845. Beyond that, I would look toward the mid-Dec high of 260.700. At that point, we’ll be closing in on the lower channel support, which is at about 260.000 today.
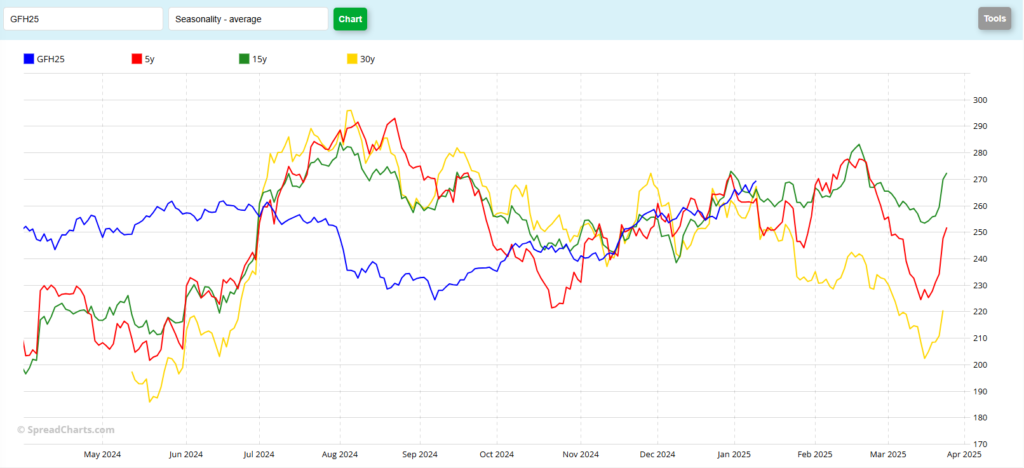
Seasonally (chart below), March Feeders do tend to go lower, although the 5-year pattern (red) suggests the Feeder end January roughly where they began. The 15-year (green) suggests a slightly lower end to January from where it started. The 30-year pattern suggests weakness until the second week of February or so. Given that Feeders haven’t exactly tracked with the seasonals this year, they’re probably not a good guide right now. But here’s the seasonal chart, what do you see?
March Feeder (seasonal)

If you have any questions about what I’ve written here, please reach out directly. I’ll answer everything that I can!
Jefferson Fosse Walsh Trading
Direct 312 957 8248 Toll Free 800 556 9411
[email protected] www.walshtrading.com
Walsh Trading, Inc. is registered as a Guaranteed Introducing Broker with the Commodity Futures Trading Commission and an NFA Member.
Futures and options trading involves substantial risk and is not suitable for all investors. Therefore, individuals should carefully consider their financial condition in deciding whether to trade. Option traders should be aware that the exercise of a long option will result in a futures position. The valuation of futures and options may fluctuate, and as a result, clients may lose more than their original investment. The information contained on this site is the opinion of the writer or was obtained from sources cited within the commentary. The impact on market prices due to seasonal or market cycles and current news events may already be reflected in market prices. PAST PERFORMANCE IS NOT NECESSARILY INDICATIVE OF FUTURE RESULTS. All information, communications, publications, and reports, including this specific material, used and distributed by Walsh Trading, Inc. (“WTI”) shall be construed as a solicitation for entering into a derivatives transaction. WTI does not distribute research reports, employ research analysts, or maintain a research department as defined in CFTC Regulation 1.71.
