The information and opinions expressed below are based on my analysis of price behavior and chart activity
March Cotton

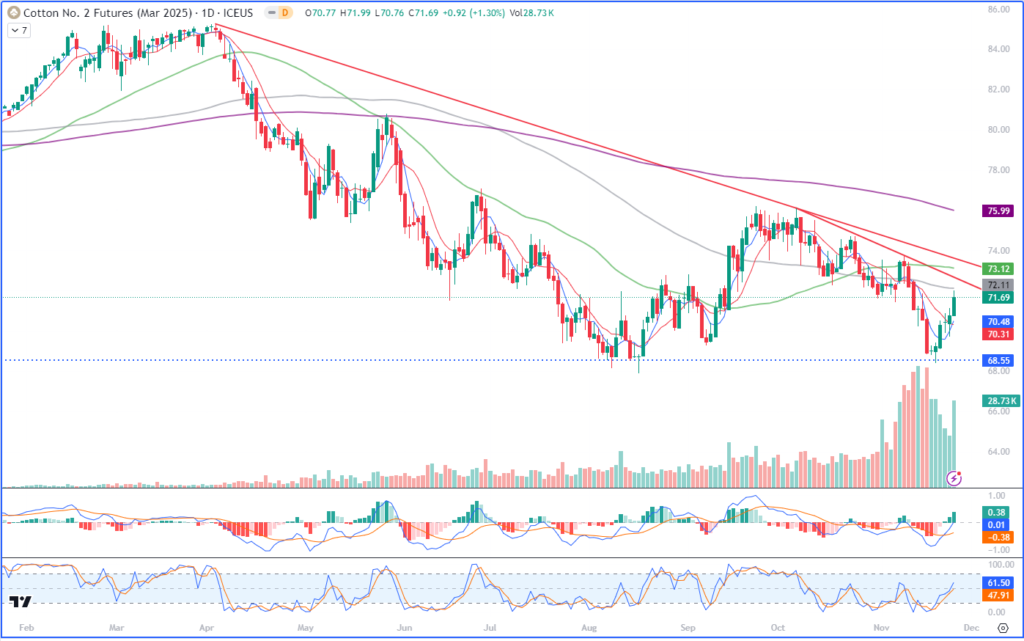
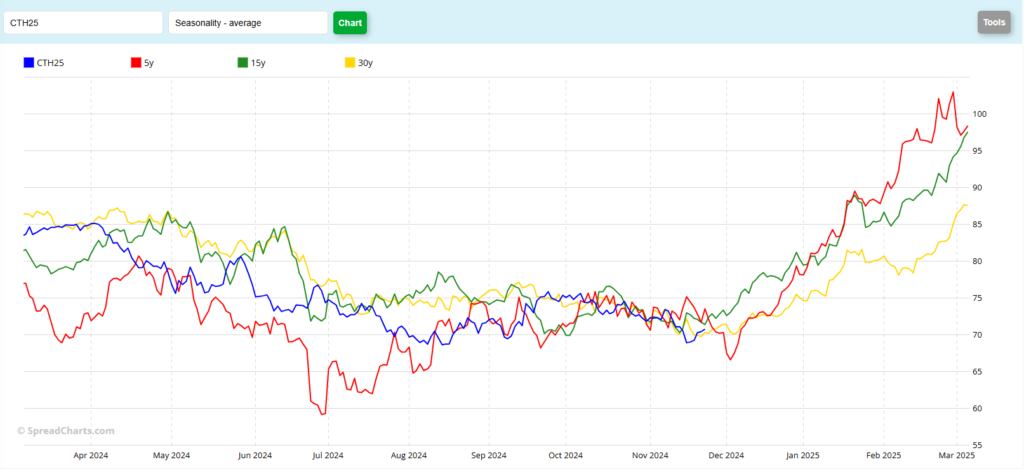
March Cotton closed the day at 71.72, up 0.95, on Monday. That strings together 6 consecutive days of gains which this market hasn’t been able to do since February of this year! A week ago, Tuesday, saw the prices spike lower, successfully testing the lows that held during August. In my opinion, the dotted blue line of support held at 68.55. Over the past 6 sessions, we’ve also seen 2 “Doji” price bars (last Monday and last Thursday) which typically indicate a point of price equilibrium to my eye. Trade following those Doji’s, I believe to be important, as a directional close outside of a Doji’s trading range seems to indicate the next direction of prices, at least to me. Last Monday’s Doji saw a directional close higher on Wednesday and last Thursday’s Doji saw a directional close higher today. That tells me, that, at least in the short-term, prices have run out of downward momentum and that we should be looking for higher prices. The 5-and 10-day moving averages flipped over into bullish territory today and are both below the market offering support levels at 70.48 and 70.31, respectively. The 100-day moving average is just overhead, showing potential resistance levels at 72.11 today, as is the 50-day average at 73.12. You’ll also notice that I’ve drawn two red trendlines on this chart. The first connects the April and October highs and that’s the one you’ll see on top, near the 73.60 level. The second connects the October and November highs and is near the 72.70 mark. Seasonally (see the chart below) this market typically makes it’s low right around this time of year and begins to rally through contract expiration. Does it happen every year? No. But over the past 10 years, I can only find one year, 2016, where it did not gain in price, from now until the end of February. Aggressive and well-margined traders may do well to consider establishing long positions in the futures. Trade will likely be volatile this week, as it is a holiday week, but I would look for an entry point near Friday’s high (71.12) or further lower near the 5-day moving average at 70.50. I would suggest the 68.50 level as a protective stop, risking a new low close. An upside target for that position may be found near the 200-day moving average, which is near 75.99 at today’s close. Traders that prefer option positions, or producers that would like to replace bales that they’ve already sold, may do well to consider March calls, which expire in 74 days. A 75.00 March Call closed today at 1.10, or $550 plus commissions and fees. If you choose to buy those calls, I would then suggest placing a GTC profit target near 2x what you paid for them. If the GTC order is hit, re-evaluate the market and see if it makes sense, at that time, to step back in and buy more call options, but don’t spend any significant amount more than you spent initially. Volume was relatively strong today, which is always a good sign on an “up” day, I think. Stochastics, lowest sub-graph, are firmly in mid-range and seem to be pointing higher. The MACD indicator, just above the Stochastic, is currently in better shape than the last two attempts to rally in late October and earlier this month and appears to be pointing toward higher prices, in my opinion. Today’s final Crop Progress report of 2024 indicates the Cotton harvest is 84% complete, a bit ahead of schedule, compared to the past 5 years.

Jefferson Fosse Walsh Trading
Direct 312 957 8248 Toll Free 800 556 9411
jfosse@walshtrading.com www.walshtrading.com
Walsh Trading, Inc. is registered as a Guaranteed Introducing Broker with the Commodity Futures Trading Commission and an NFA Member.
Futures and options trading involves substantial risk and is not suitable for all investors. Therefore, individuals should carefully consider their financial condition in deciding whether to trade. Option traders should be aware that the exercise of a long option will result in a futures position. The valuation of futures and options may fluctuate, and as a result, clients may lose more than their original investment. The information contained on this site is the opinion of the writer or was obtained from sources cited within the commentary. The impact on market prices due to seasonal or market cycles and current news events may already be reflected in market prices. PAST PERFORMANCE IS NOT NECESSARILY INDICATIVE OF FUTURE RESULTS. All information, communications, publications, and reports, including this specific material, used and distributed by Walsh Trading, Inc. (“WTI”) shall be construed as a solicitation for entering into a derivatives transaction. WTI does not distribute research reports, employ research analysts, or maintain a research department as defined in CFTC Regulation 1.71.
