The information and opinions expressed below are based on my analysis of price behavior and chart activity
March Corn

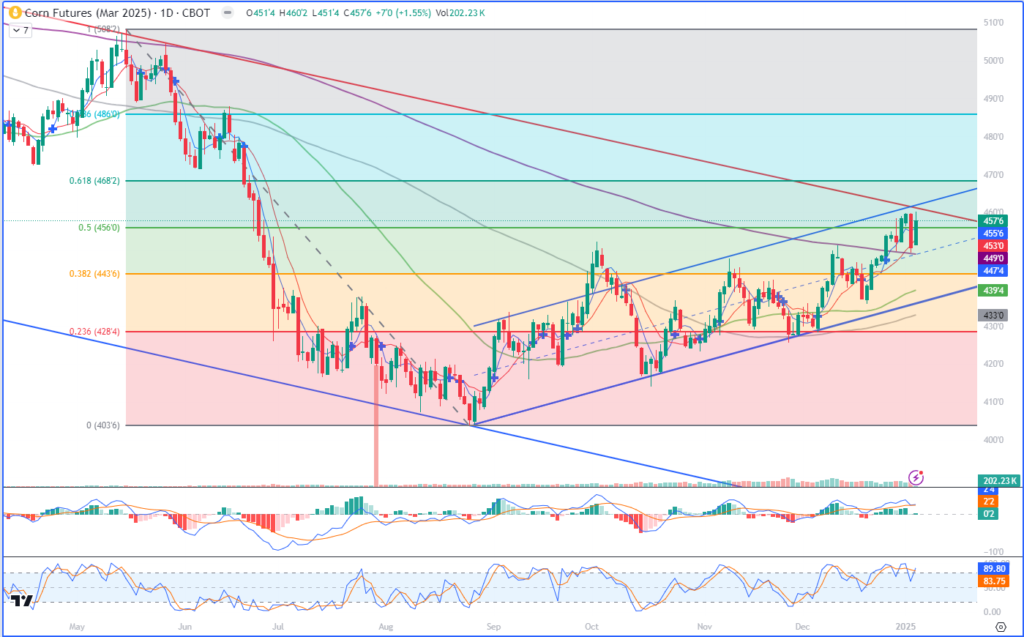
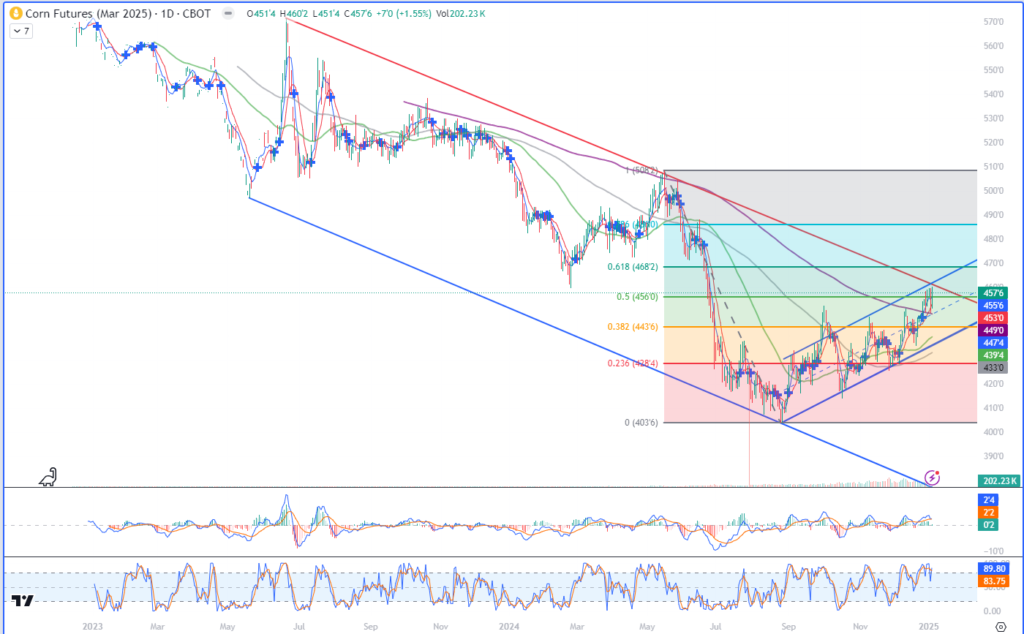
March Corn started this week gaining 7 cents to close at 4.57 ¾. This will be (almost) the first full week of trading since the week before Christmas. I say “almost” because we’ll lose a little over an hour of trading this Thursday afternoon because of the National Day of Mourning. Last week was the final week of “holiday trade” and I would definitely expect trade volumes to revert back to normal levels this week. Friday this week, the 10th, the USDA will release their final report for the crop that’s been harvested and all eyes are on those numbers. Check back here later in the week for estimates of what the USDA might say. Generally speaking, Corn had been performing well. Since I last wrote about it on December 19th, prices have rallied some 17 cents. Corn closed above the 200-day moving average on Dec 26th and has tested that level a couple of times since then, including this past Friday. Today that average is at 4.49 and should offer support, coincidentally, with the big, fat, round number of 4.50. You’ll notice by looking at the chart above that prices are above the 50% Fibonacci level (4.56) from the May high to the August low. The Fibonacci levels are indicated toward the left side and are denoted by the various shaded areas. Since we’ve closed back above that level today, that indicates to my eye that at further test of the 62% level (4.68 1/4) might be in the cards. The closest round number to that is 4.70, or very close to the April and June lows that you’ll see toward the left. At this time, those lows (4.72 ¼ and 4.71 ½, respectively) appear to offer the next significant resistance levels from prices we’re previously traded. There is some trendline resistance, drawn off the June ’23 and May ’24 highs, that may appear. Today that (red horizontal) is at 4.61 ¼, about 1 cent over today’s high. That trendline resistance may prove to be key. Look at the chart I’ve included below…to my eye, we appear to have Corn right now in an uptrending channel (blue, upward slanting) that is currently nearing long-term trend resistance. If the market fails to clear above this trendline convincingly, I have some concern that we may see prices head back toward channel/trend support that is at 3.80. Fundamentally, I’m NOT bearish, just telling you what I think could happen. The fact is that this market has been trending lower for 2 years and long-term trends can be tough to break.
March Corn (life-of-contract)

On the supply/demand side, demand continues to outpace recent years, with today’s Export Inspection report showing Corn shipments are exceeding last year’s pace by about 24%.
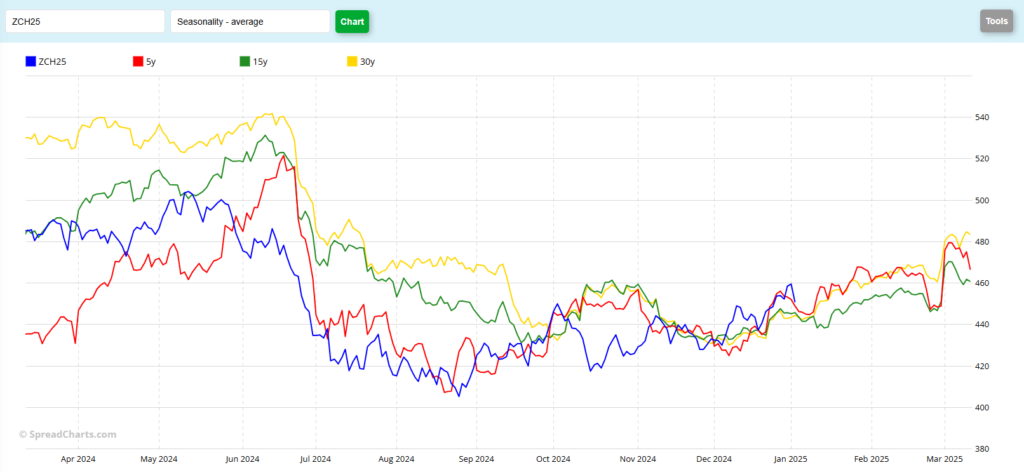
The Seasonal Chart below, indicates that the March contract usually rallies following this USDA report into expiration. However, 2023 and 2024 saw the opposite happen, prices fell into expiration, starting the downtrend we’re in now.
March Corn (seasonal)

Jefferson Fosse Walsh Trading
Direct 312 957 8248 Toll Free 800 556 9411
jfosse@walshtrading.com www.walshtrading.com
Walsh Trading, Inc. is registered as a Guaranteed Introducing Broker with the Commodity Futures Trading Commission and an NFA Member.
Futures and options trading involves substantial risk and is not suitable for all investors. Therefore, individuals should carefully consider their financial condition in deciding whether to trade. Option traders should be aware that the exercise of a long option will result in a futures position. The valuation of futures and options may fluctuate, and as a result, clients may lose more than their original investment. The information contained on this site is the opinion of the writer or was obtained from sources cited within the commentary. The impact on market prices due to seasonal or market cycles and current news events may already be reflected in market prices. PAST PERFORMANCE IS NOT NECESSARILY INDICATIVE OF FUTURE RESULTS. All information, communications, publications, and reports, including this specific material, used and distributed by Walsh Trading, Inc. (“WTI”) shall be construed as a solicitation for entering into a derivatives transaction. WTI does not distribute research reports, employ research analysts, or maintain a research department as defined in CFTC Regulation 1.71.
