The information and opinions expressed below are based on my analysis of price behavior and chart activity
March Corn

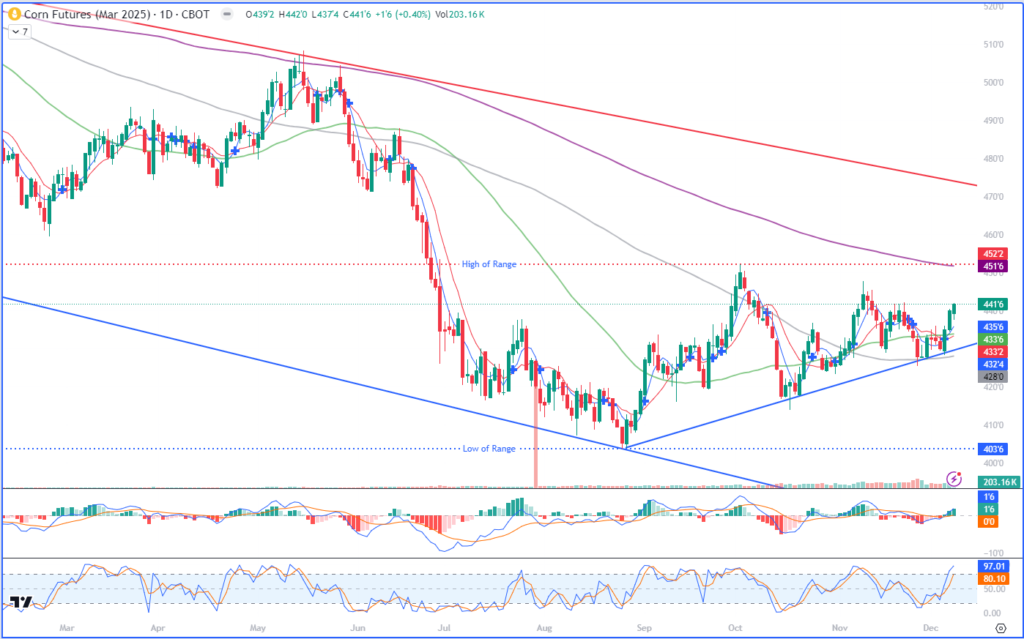
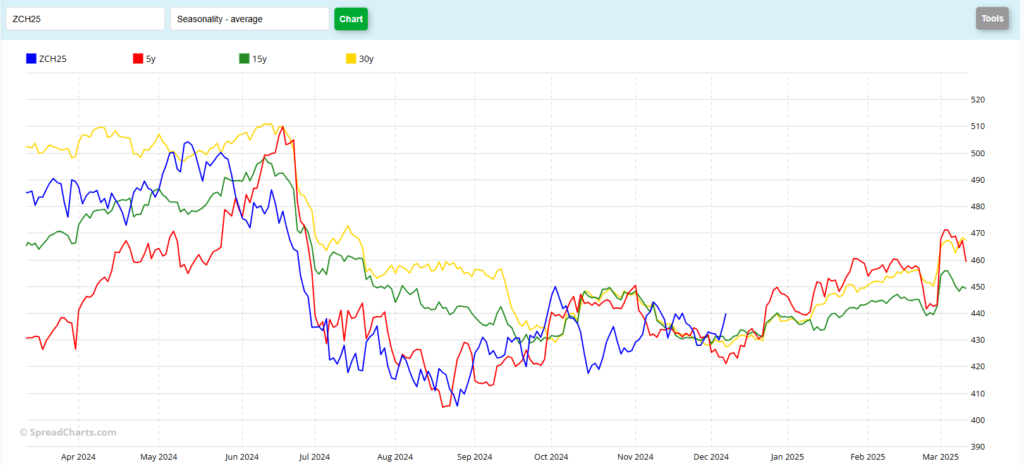
As we start off this week, March Corn settled up 1 ¾ cents, at 4.41 ¾. Monday’s settlement was the highest since Friday, November 8th. Traders are looking forward to tomorrow’s 11 AM CT release of the December Crop Production and Supply/Demand estimates. The average estimates that I’ve seen indicate that the market is expecting a slight reduction in US Ending Stock from last month’s number of 1.938. I think that most of any reduction will come from a drop in harvested acres and a slight increase in consumption. As far as South American Production, on balance there should be a slight reduction in their estimates, with the general expectation being a 500,000 metric ton drop for Argentina and a 200,000 increase for Brazil. Last month those numbers were at 51.0 and 127.0 million metric tons, respectively. World Ending Stocks may also see a slight drop of 500,000 metric tons, down from 304.1 MMT in November and 314.2 last year. Today’s Export Inspection report shows that this year is outpacing last year’s exports. Currently they sit at 12.1 MMT, up from 9.1 last year. From where I’m sitting, unless something comes from “outside” the Grain markets, the chart seems fairly bullish. Trendline support (upward blue horizontal) was tested last week and the market held support and has since bounced some 13 cents from that test of last Thursday’s low. The 5-and 10-day moving averages shifted to bullish territory last week, and now seem to offer support at 4.35 ¾ and 4.33 ¼, respectively. We also saw the market close above the 100-day average on Thursday, keeping the bullish crossover of the 50-and 100- day averages (Nov 5th) intact, indicating to me that traders would rather buy than sell, at this point in time. The 50-day average is at 4.33 ¾ today, with the 100-day average at 4.28. The trendline support that I mentioned above, comes in at about 4.30 on my chart. From here, the resistance levels appear to be at 4.42 (today’s high) and then to the Nov 8th high of 4.47 ¾. The nice big, fat round number of 4.50 would be the next target above those levels. The seasonal chart (below) indicates to my eye that we should expect higher prices until roughly the middle of February. And while there are many markets that are not following their “normal” seasonal patterns this year, Corn, for most of the year, actually seems to be following along fairly closely. That seasonal chart seems to show, perhaps, another 20 cents in upside potential. I think I agree with that. A 50% retracement (not shown) of the May high to the Aug low comes in at 4.56 ¼. The 200-day moving average (purple) is at 4.51 ¾ today. I think that both of those levels will be tested in the coming weeks. Producers may choose to wait until then to sell any remaining unpriced bushels, but as the market is not paying enough of a carry. I think you’d be better served by selling the cash grain and looking to re-own those bushels with inexpensive March Calls. March 4.50 calls settled today at 9 5/8 or $481.25 plus commissions and fees. For my math, that’s not a lot to pay to re-own 5,000 bushels that’s is worth a little over $22,000, at today’s close. That strike price currently has a “delta” of .389, so to get closer to a 1:1 ratio, you’ll need roughly 2.5 of those to equal the dollar value change of 1 contract. Have you ever wondered why your chosen options didn’t work out as well as you had hoped when the market went your way? My experience tells me it’s likely because you didn’t factor in position or option delta and didn’t buy enough to accurately cover your exposure. Stochastics (bottom subgraph) are a bit overbought, but not excessively so and not in need of any correction, in my opinion. MACD (just above that) has been firming up and is pointing upward. For traders that prefer to use the futures, to my eye, the long entry point was last week, near the 4.32 ½ level, almost 10 cents lower. Personally, I’m not usually a fan of guessing what USDA reports say and putting on futures trades just before. I’d much rather use options to guess at USDA outcomes, especially the much less expensive serial options. Aggressive and well-margined futures traders may do well to sit on their hands and wait for the next entry. If you’re very aggressive, you may choose to try to buy this market near that level, if the USDA report reaction allows for it. If you choose that route, I think your risk or stop loss should be near that Nov 26th low of 4.25 ½. If a stop is triggered at that level, as bullish as I am, that would project a move down to the $4.10-4.00 level. If you’d like to learn more about Option Delta or if you have any questions about what you’ve read here, give me a call.
March Corn Seasonal

Jefferson Fosse Walsh Trading
Direct 312 957 8248 Toll Free 800 556 9411
jfosse@walshtrading.com www.walshtrading.com
Walsh Trading, Inc. is registered as a Guaranteed Introducing Broker with the Commodity Futures Trading Commission and an NFA Member.
Futures and options trading involves substantial risk and is not suitable for all investors. Therefore, individuals should carefully consider their financial condition in deciding whether to trade. Option traders should be aware that the exercise of a long option will result in a futures position. The valuation of futures and options may fluctuate, and as a result, clients may lose more than their original investment. The information contained on this site is the opinion of the writer or was obtained from sources cited within the commentary. The impact on market prices due to seasonal or market cycles and current news events may already be reflected in market prices. PAST PERFORMANCE IS NOT NECESSARILY INDICATIVE OF FUTURE RESULTS. All information, communications, publications, and reports, including this specific material, used and distributed by Walsh Trading, Inc. (“WTI”) shall be construed as a solicitation for entering into a derivatives transaction. WTI does not distribute research reports, employ research analysts, or maintain a research department as defined in CFTC Regulation 1.71.
