
The information and opinions expressed below are based on my analysis of price behavior and chart activity
July Soymeal (Daily)
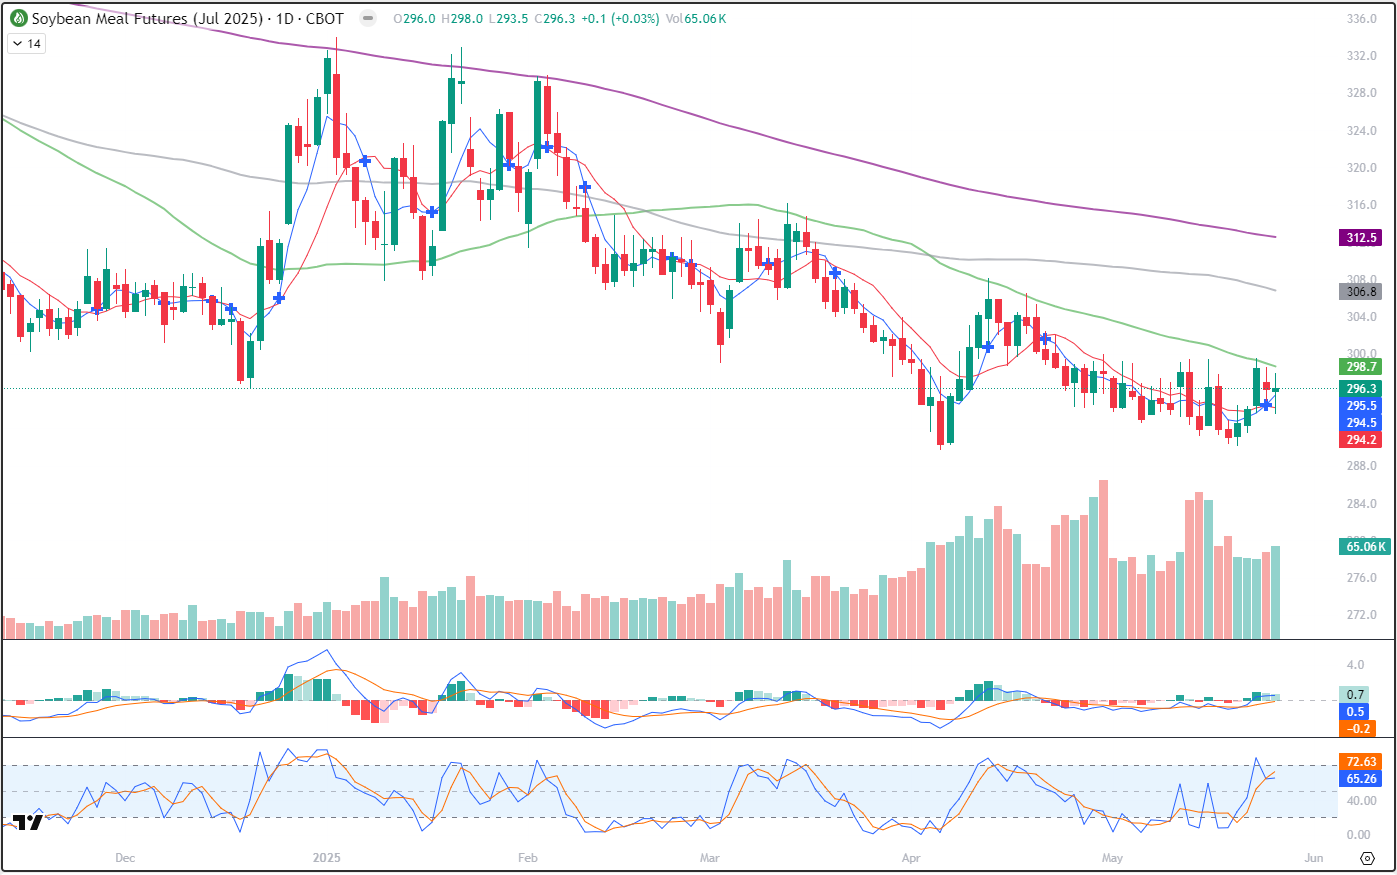
Today, July Soymeal closed up just 1 tick and settled at 296.30. Last week, this market staged a mini-rally from Tuesday’s low (290.10) to Thursday’s high (299.60) and the 5- and 10-day moving averages made a bullish crossover on Friday. Those averages are at 294.20 (red, 10-day) and 295.50 (blue, 5-day) following today’s close. Stochastics are pointing higher, at the moment, but did manage to show a tiny bit of overbought conditions with Thursday’s close. The 50-day average (green, 298.70) has been strong resistance for a couple of months now, since the first close under that average on February 11th. That average was tested last week, but the market has yet to fall away from it, like it has in the past 2-3 months. The downward momentum has seemingly vanished since the contract lows was set on April 4th. Don’t mistake me, it’s still in a bearish trend. My point is that it no longer seems eager to find out how low and how fast it can get there. That might be a sign that a turn higher is in the future. Aggressive and well-margined traders may do well to consider long futures positions at these price levels. Perhaps a target to the upside of about 10.00 from where you get in might be reasonable. That would put prices near the 100-day average (grey, 306.80) or a little more than 10.00 from today’s close. If the market can clear the 300.00 level this week, you may want to consider moving the protective stop up, but I do think your initial risk/reverse level should be at or near the contract low of 289.70 from April 4th. Less aggressive traders may do well to choose a Call option. The July options expire in 24 days. A 300.00 July Call settled at 4.25 today, or $425 plus commissions/fees. I would suggest setting a GTC profit target at 2x what you paid for the option. If that target is hit, then re-evaluate the market and the chart.
July Soymeal (Weekly)

The weekly July Soymeal chart shows a market that has been declining for most of the past two years. Rallies have been met with selling pressure, as evidenced by the large, thin wicks on the candles. Look at January of this year or the highs from May of last year to see what I mean. The 5-and 10-week moving averages are trending downward. (blue/red, 295.10 and 297.40, respectively) The market is currently between both of those, with the 10-week offering some overhead resistance in our shortened week and the 5-week now offering some support. Stochastics are starting to hook up out of oversold status and the market is certainly “due” for a rally. I think you might notice by looking at the chart, that this market has been more oversold that overbought over the last couple of years. The 50-week average (green, 314.70) offers long-term resistance, dating back to at least last May, to my eye, if not further back. The 100-week is higher still, up near 339.10. The contract low was set in the last week of March-1st week of April at 289.70 and has not been tested since then. For aggressive and well-margined traders that like to buy markets when they’re down, I think that’s where your risk is at, at new contract lows.
Jefferson Fosse Walsh Trading
Direct 312 957 8248 Toll Free 800 556 9411
jfosse@walshtrading.com www.walshtrading.com
Walsh Trading, Inc. is registered as a Guaranteed Introducing Broker with the Commodity Futures Trading Commission and an NFA Member.
Futures and options trading involves substantial risk and is not suitable for all investors. Therefore, individuals should carefully consider their financial condition in deciding whether to trade. Option traders should be aware that the exercise of a long option will result in a futures position. The valuation of futures and options may fluctuate, and as a result, clients may lose more than their original investment. The information contained on this site is the opinion of the writer or was obtained from sources cited within the commentary. The impact on market prices due to seasonal or market cycles and current news events may already be reflected in market prices. PAST PERFORMANCE IS NOT NECESSARILY INDICATIVE OF FUTURE RESULTS. All information, communications, publications, and reports, including this specific material, used and distributed by Walsh Trading, Inc. (“WTI”) shall be construed as a solicitation for entering into a derivatives transaction. WTI does not distribute research reports, employ research analysts, or maintain a research department as defined in CFTC Regulation 1.71.