
The information and opinions expressed below are based on my analysis of price behavior and chart activity
July Soybeans (Daily)
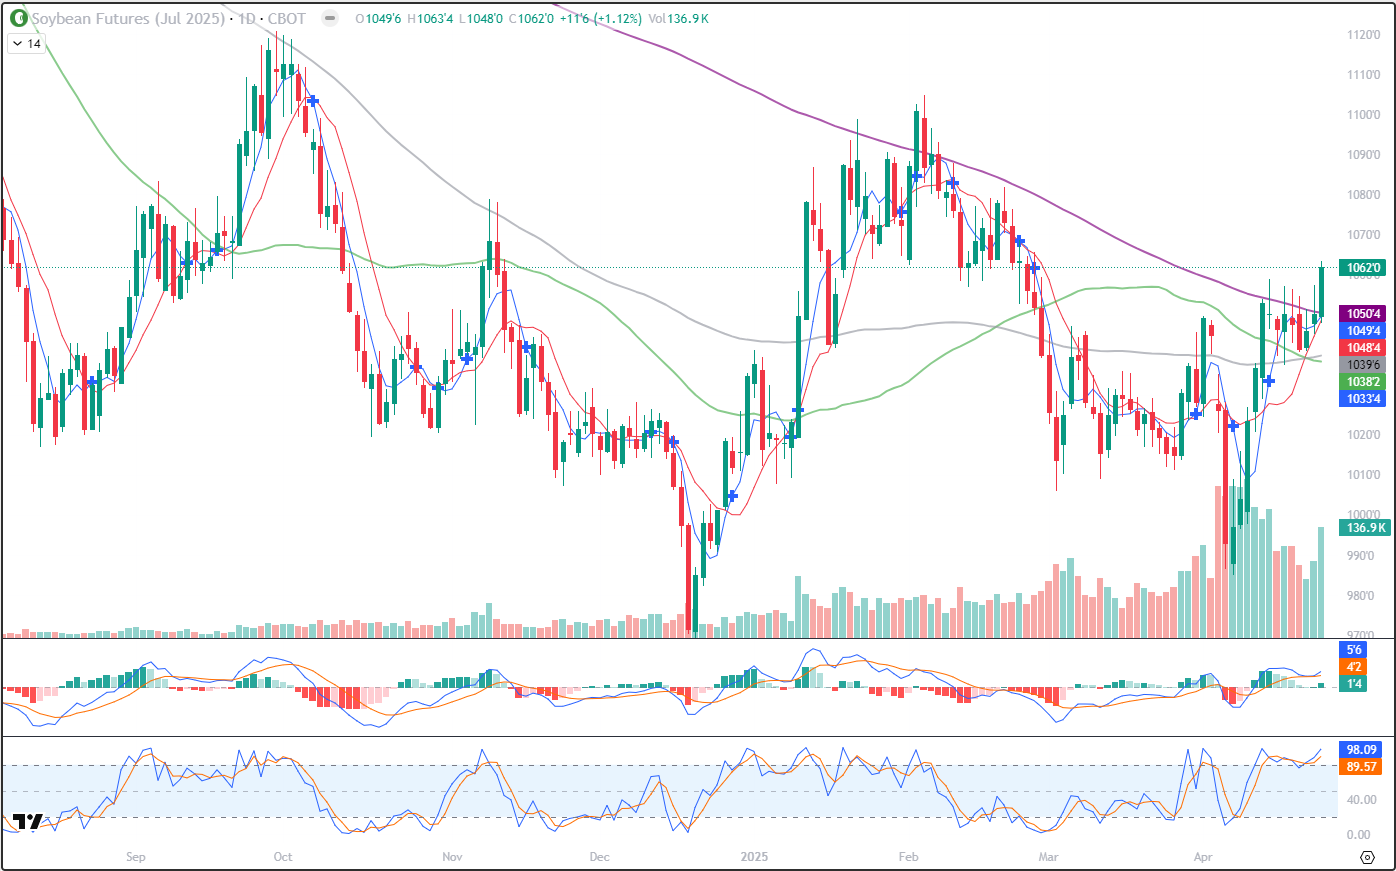
Today, July Soybeans closed at $10.62, up 11 ¾ cents on the day. That’s the highest close we’ve seen since February 25th, two months ago. And it was also the first close above the 200-day moving average (purple, 10.50 ½) since Feb. 4th. 8 out of the last 9 days the July contract has interacted with that long-term average, finally breaking through that resistance today. With this close, the Bean market may have changed the long-term trend. Before the brief tariff meltdown at the beginning of April, Soybeans had started to show signs of bullish life, closing at 10.49 ¾ on April 1st and heading up. That was a Tuesday, and by that Friday, Beans had dropped to close at 9.93 in reaction to the tariff announcements. But the market gained all of that back, and then some over the following week, closing at 10.53 on April 11th. July Soybeans have chopped between the 200- and 100-day moving averages (grey, 10.39 ¾) before making today’s breakout. The tariff pressure was short-lived and did not result in “new” lows or any other meaningful damage to the chart. And, as of this writing, the tariff situation hasn’t changed or been “resolved” in any meaningful way. The last time the 200-day average was broken on a closing basis, it only held that level for a day. The consolidation, or sideways movement, on the price chart over the last week, hints to me that this may be different. For a little over a week, the prices have been stuck against resistance, but have been unwilling or unable to make a move. Volume has been increasing all week, compared to last, which I think is supportive. Stochastics (subgraph) are a bit overbought, right now, but if the breakout continues, markets can maintain that condition for extended periods. From here, I would expect a move up to 10.81 ¾, the Feb. 21st high, and then to the next big, round number of 11.00 before taking out the high of 11.04 3/4, set on Feb 5th. Aggressive and well-margined traders may do well to consider long futures positions. You may find support levels to establish those near 10.59, 10.57 ½ or perhaps even a re-test of 10.50. I think your stop on that should be somewhere slightly below the low of this week, which was 10.40 ¾. Less aggressive traders or producers may do well to consider Call options or other bullish option strategies. For example, the July 11.00 calls, expire in 57 days, and settled at 15 7/8 today, or $793.75, plus your commissions and fees. If you go that route, perhaps setting a GTC profit target at 2x what you paid would work out for you.
July Soybeans (Weekly)
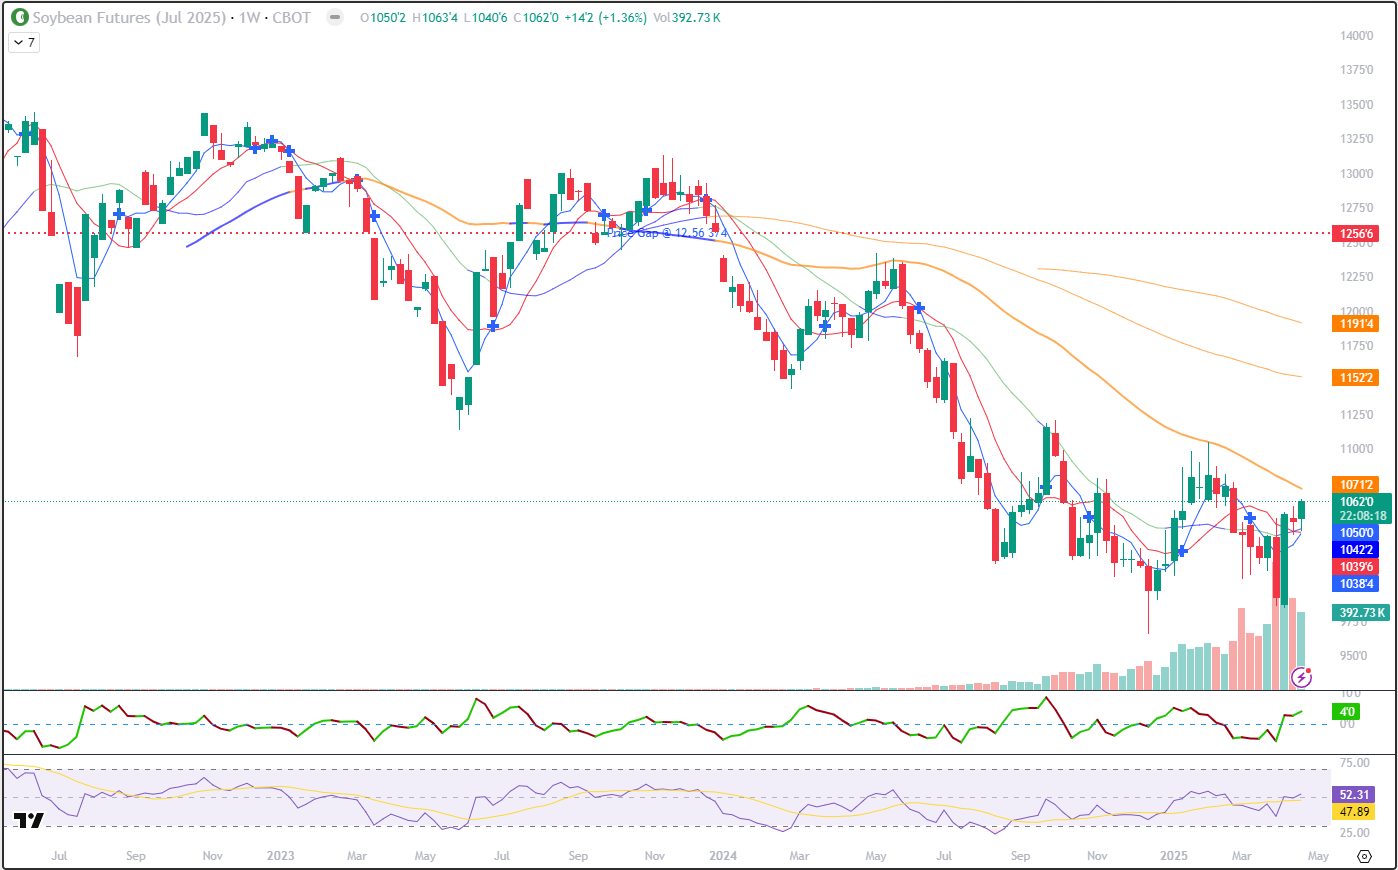
To my eye, the weekly July Soybean chart looks like a market that is trying to find a bottom. Since making the contract high at 13.74 ¾ in April of 22 (3 years ago!) the market has been working its way lower. Every few months, new lows would get made and the subsequent rallies would fail to test or take out the previous highs. Lower lows and lower highs have been a fairly consistent feature of the Bean market over the past 3 years. Until recently, I think. July Beans made that spike low at 9.66 in the middle of December and then rallied for a bit to take out early-November highs. The “tariff selloff” did not get that low (9.85) and posted a large Bullish Engulfment the following week (big green bar, 3 bars/weeks back) Last week’s trade was a relatively narrow range but did post higher highs and lows and this week we’re doing that again. I see several moving averages just below the market, the 5-week (blue, 10.38 1/2) the 10-week (red, 10.39 ¾) are pictured on the chart above and have been good support levels for the past two weeks. (the 20-week, not pictured, is right there at 10.42 ¼, as well) The 5- and 10- are thisclose to flipping back into bullish territory, I think we should see that occur with next week’s trade. Stochastics (subgraph) are just above mid-range and pointing higher prices. There is overhead resistance, with the closest being the 50-week (orange, 10.71 ¼) and the 100-week (also orange, 11.52 ¼) You may also notice that there is a gap on that chart, left at the beginning of 2024 up at 12.56 ¾. It would be foolish at this point, I think, to shoot for that as a target. I see nothing, currently, to indicate a wild rally like that. But futures market do tend to fill in price gaps, regardless of how long it takes.
Jefferson Fosse Walsh Trading
Direct 312 957 8248 Toll Free 800 556 9411
jfosse@walshtrading.com www.walshtrading.com
Walsh Trading, Inc. is registered as a Guaranteed Introducing Broker with the Commodity Futures Trading Commission and an NFA Member.
Futures and options trading involves substantial risk and is not suitable for all investors. Therefore, individuals should carefully consider their financial condition in deciding whether to trade. Option traders should be aware that the exercise of a long option will result in a futures position. The valuation of futures and options may fluctuate, and as a result, clients may lose more than their original investment. The information contained on this site is the opinion of the writer or was obtained from sources cited within the commentary. The impact on market prices due to seasonal or market cycles and current news events may already be reflected in market prices. PAST PERFORMANCE IS NOT NECESSARILY INDICATIVE OF FUTURE RESULTS. All information, communications, publications, and reports, including this specific material, used and distributed by Walsh Trading, Inc. (“WTI”) shall be construed as a solicitation for entering into a derivatives transaction. WTI does not distribute research reports, employ research analysts, or maintain a research department as defined in CFTC Regulation 1.71.