
The information and opinions expressed below are based on my analysis of price behavior and chart activity
July Soybean Oil (Daily)
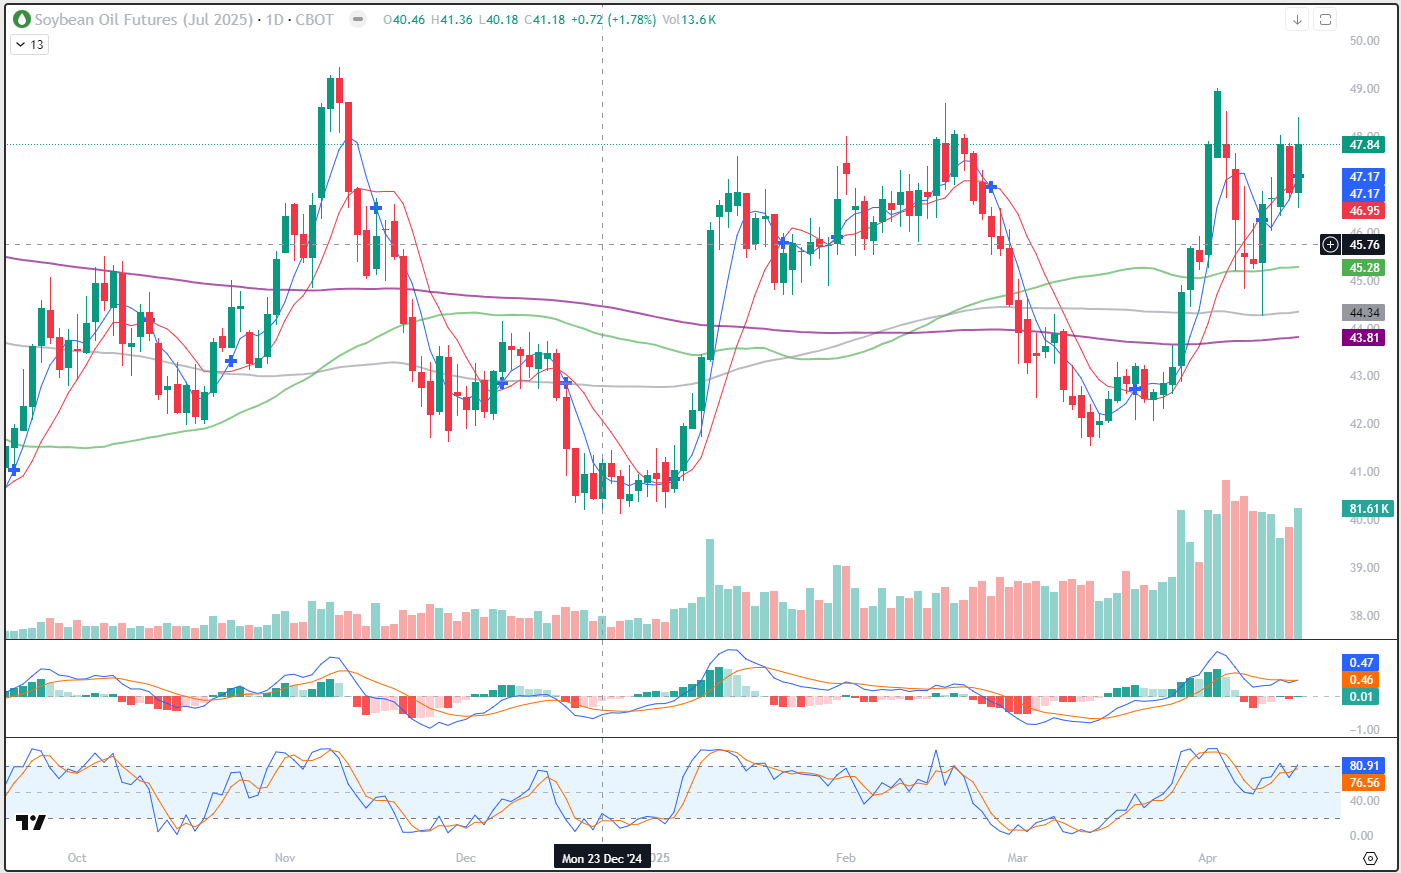
July Bean Oil closed at 47.84 today, up 0.99 from Monday’s close. This is the highest close in the July contract since April 2nd, just before all of the tariff news hit the markets. Since then, prices have retraced but now seem to be resuming the uptrend that appeared following the 41.54 low on March 13th. You might notice that the longer term-moving averages have held as support, with the 50-day average (green, 45.28 today) being tested on April 4th, 7th, 8th and 9th. The 100-day (grey, 44.34 today) was hit on April 9th, but the prices closed some 2.35 off the lows that day, which I think was a good sign for the bulls out there. Since the 1st of the year, Bean Oil prices seem to be posting higher highs and higher lows. Even with the sharp selling pressure that emerged over the last half of February into the middle of March, we did not see new lows set. Subsequently, prices rallied again, setting a new high for the move on April 2nd, eclipsing the February 19th high. To my eye, this market seems poised to rally past that 49.01 high. The next upside target might be the November high at 49.46. Short-term moving averages, the 5-day and 10-day (blue and red, 47.17 and 46.95, respectively) made a bullish crossover today and the trading volume was the highest since April 7th. I think both of those conditions tend to add to the bullish posture. Stochastics, in the bottom subgraph, are approaching overbought status but still have some room to go up. Support could be found near the 5- and 10-day averages that I mentioned a sentence or two ago. Last week’s high of 48.04 may offer a closing resistance level, along with the April 2nd high of 49.01. From there I would look to the big, round number of 50.00, which is a level this contract hasn’t hit since November of 2023. Aggressive and well-margined traders may do well to consider long futures positions, with a risk/reverse below last Friday’s low of 46.34.
July Soybean Oil (Weekly)
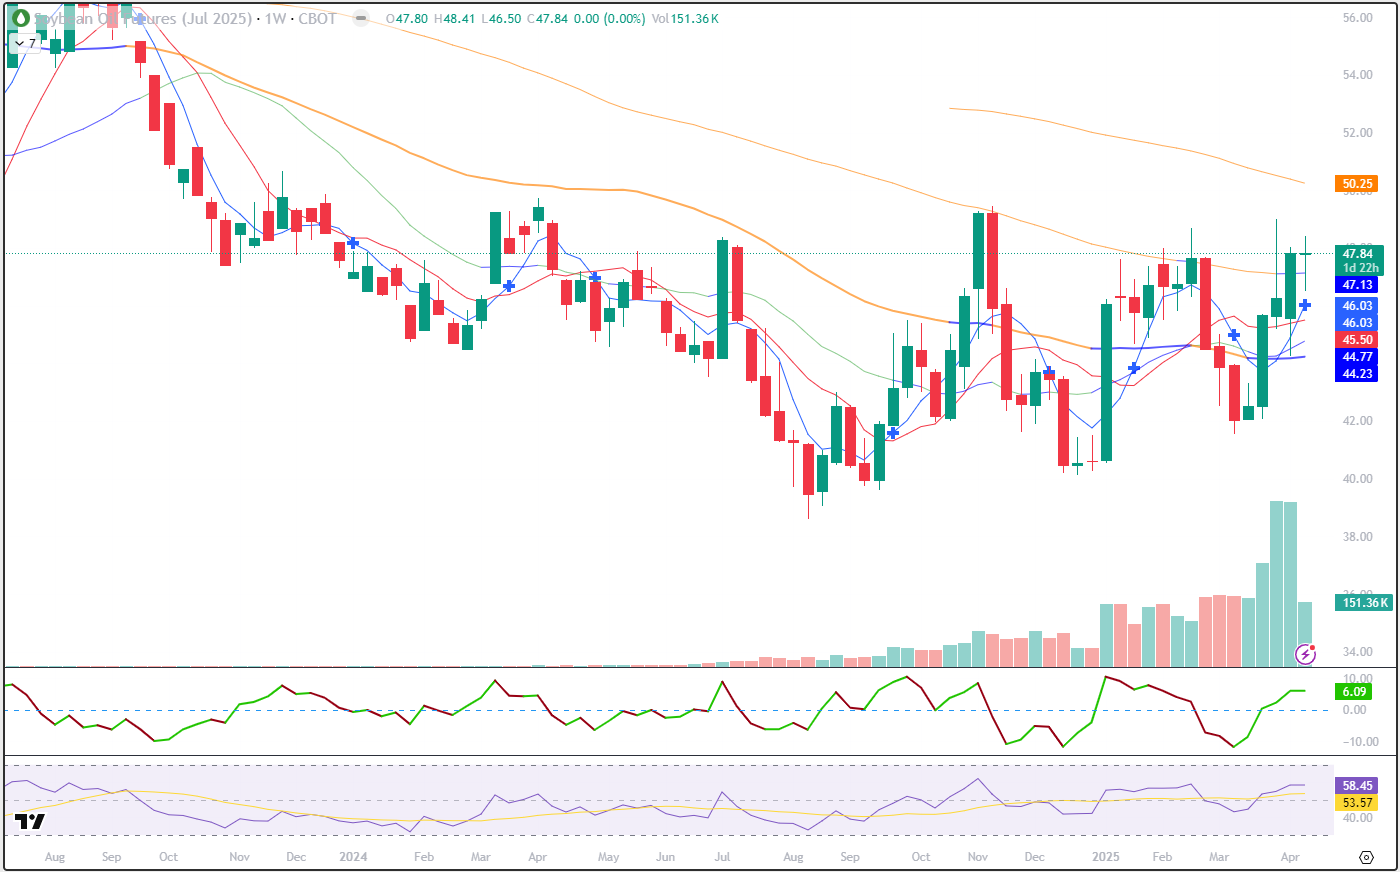
The weekly July Bean Oil chart is showing signs of bullishness, I think. Last week was the first significant weekly close over the 100-week moving average (grey, 47.13) We did see a close like that in February, but it immediately reversed direction and went back down. I think last week’s close is significant because prices have traded above that moving average level a few times this year, but we’ve usually seen price failures right after. I think the current “failure” was two weeks ago (3 bars) and price levels have come right back up. The shorter-term averages on this chart, the 5-week and 10-week (blue and red, 46.03 and 45.50, respectively) are also making a bullish crossover this week, which is usually supportive, I think. The 50-week average wasn’t tested last week, but it got very close before rebounding. That level is (green) at 44.23 today. Bean Oil prices, like the rest of the Soy and Grain contracts, have been trending lower for a long time. To my eye, it seems as if the trend is shifting…what do you see?
If you like what you’ve read here and would like to see more like this, please Click here and sign up for our daily futures market email.
Jefferson Fosse Walsh Trading
Direct 312 957 8248 Toll Free 800 556 9411
jfosse@walshtrading.com www.walshtrading.com
Walsh Trading, Inc. is registered as a Guaranteed Introducing Broker with the Commodity Futures Trading Commission and an NFA Member.
Futures and options trading involves substantial risk and is not suitable for all investors. Therefore, individuals should carefully consider their financial condition in deciding whether to trade. Option traders should be aware that the exercise of a long option will result in a futures position. The valuation of futures and options may fluctuate, and as a result, clients may lose more than their original investment. The information contained on this site is the opinion of the writer or was obtained from sources cited within the commentary. The impact on market prices due to seasonal or market cycles and current news events may already be reflected in market prices. PAST PERFORMANCE IS NOT NECESSARILY INDICATIVE OF FUTURE RESULTS. All information, communications, publications, and reports, including this specific material, used and distributed by Walsh Trading, Inc. (“WTI”) shall be construed as a solicitation for entering into a derivatives transaction. WTI does not distribute research reports, employ research analysts, or maintain a research department as defined in CFTC Regulation 1.71.