
The information and opinions expressed below are based on my analysis of price behavior and chart activity
July Copper (Daily)
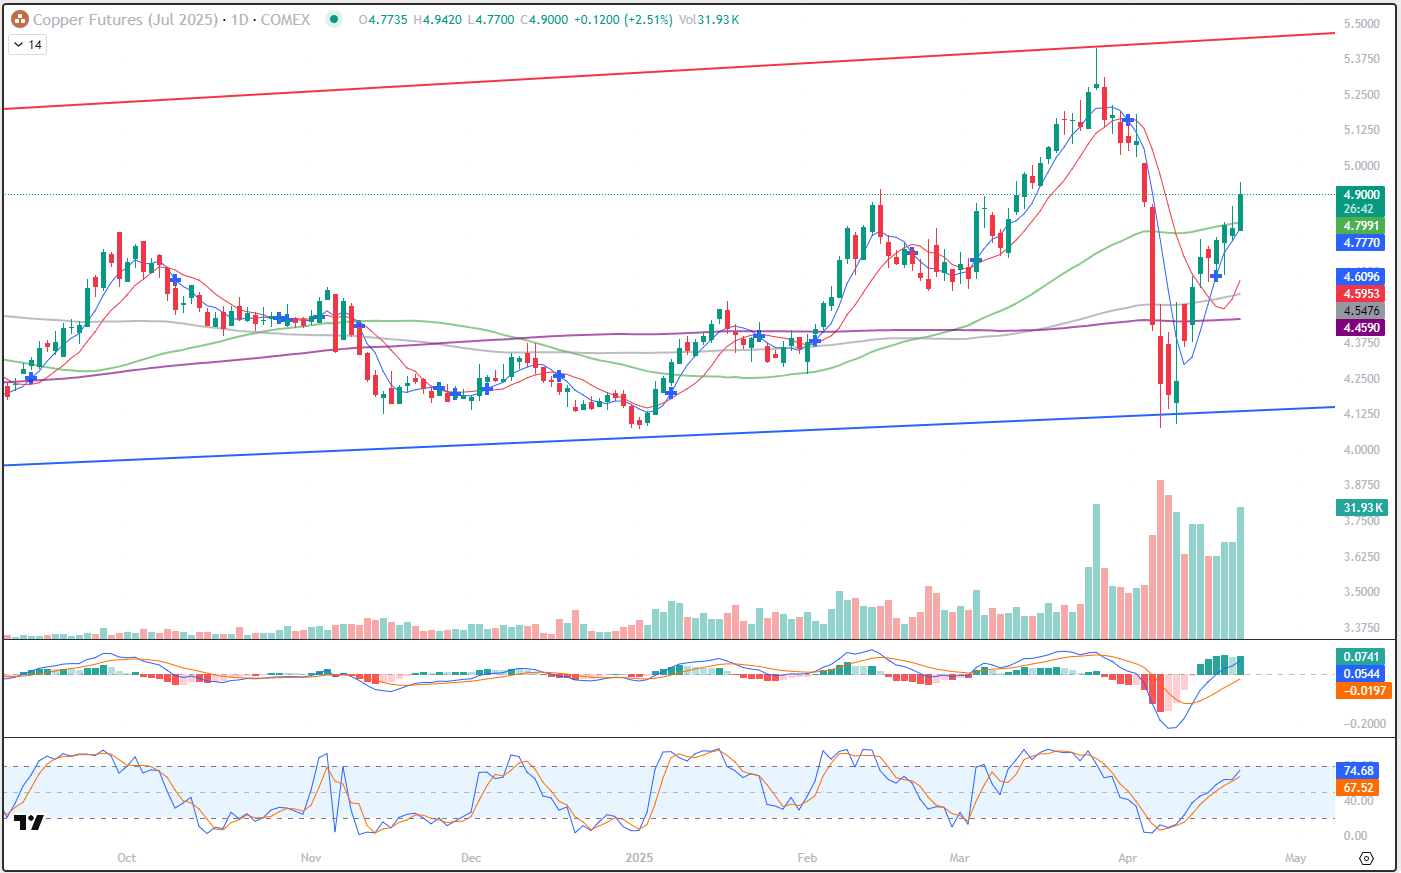
As of this writing, July Copper is trading up 12.20 cents at 4.9025, gaining a little over 2.5% on the day. That seems like a strong move to my eye, as the July contract has cleared above the 50-day moving average (green, 4.7992) after running into resistance at that average over the past two sessions. Like many markets, Copper peaked in Late March, before the tariffs were announced, on fears of how/what the tariffs might be. The “tariff selloff” began in earnest on Thursday, April 3rd. 4 very angry, red bars later, the selling pressure dried up and the red metal began climbing back higher. It seems unlikely, but that selling pressure did not result in a new low for 2025. That honor is still being held by the first trading day of 2025, January 2nd, at 4.0725. The April 7th low did get very close to that, 4.0740, but did not breach. Before all of the tariff noise, Copper was on a seemingly nice and steady uptrend that started in December. I think that’s what Copper prices intend to do again. The short-term moving averages that I have on the chart, the 5-dand 10-day (blue, red, at 4.7779 and 4.5958, respectively) crossed over into bullish territory with last Wednesday’s trade and are still pointing higher. The longer-term averages, the 100-day (grey, 4.5776) and 200-day (purple, 4.4590) are both well below the market and also inclining higher. Trade volume so far today is the highest since the last bid, red, angry day down (April 8th) which I think is friendly to prices. Aggressive and well-margined traders may do well to consider long futures positions in July Copper, perhaps buying against Monday’s high of 4.8565 or a test of support at the 50-day average. I think your risk/reverse level should be just under Monday’s low of 4.7375. Look for a target near the red overhead trendline, roughly 5.4450-ish today. Doing the math from Monday’s high to Monday’s low would be a potential risk of $2,975 (plus your commissions and fees) with a potential gain of $14,712.50 at the target of 5.4450 (less your commissions and fees) per contract. Less aggressive traders may do well to consider using options. Reach out if you need help with a strategy.
July Copper (Weekly)
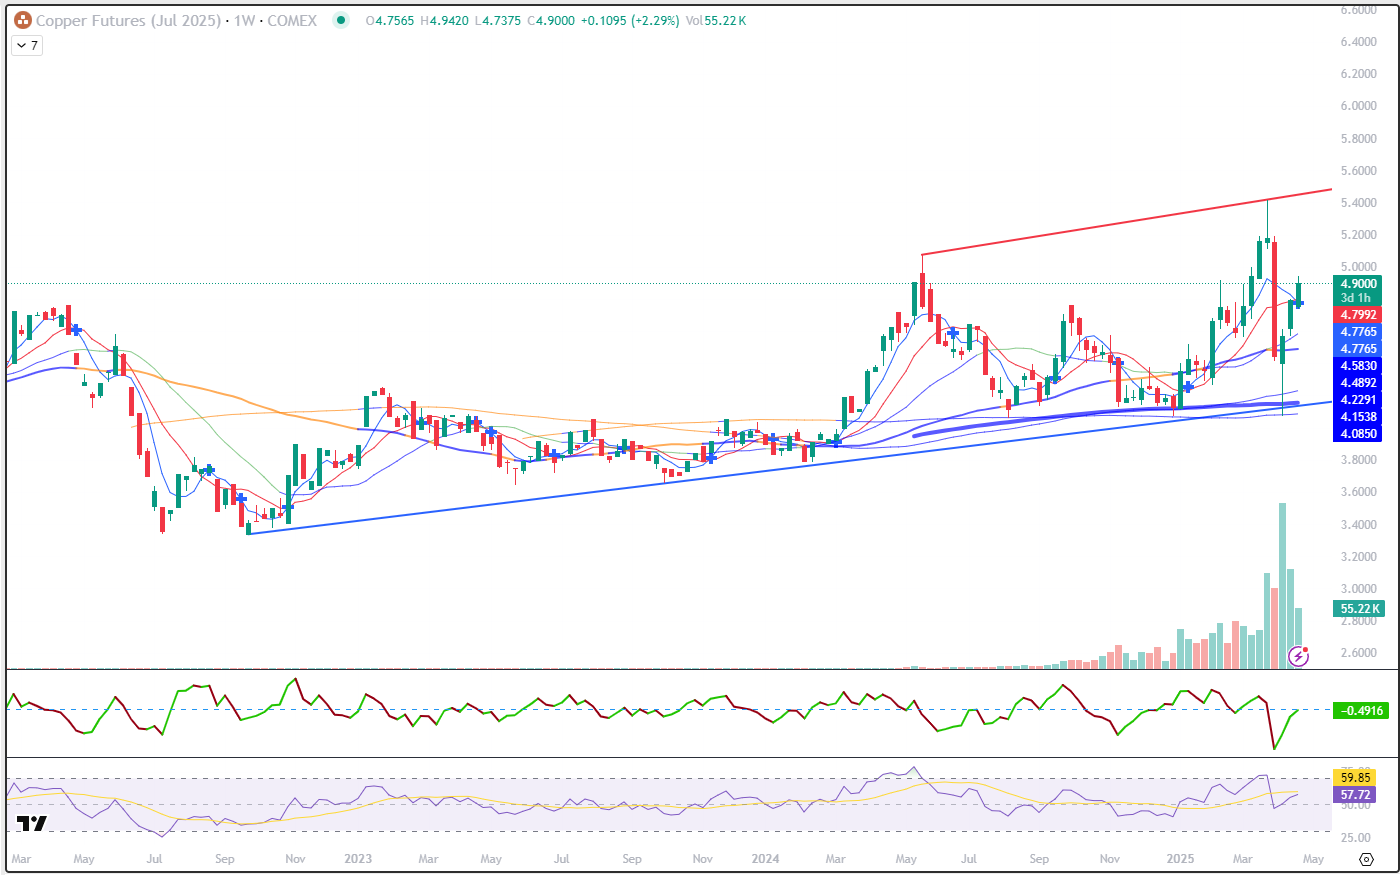
This weekly chart of July Copper goes back for a little over two years. Including this week’s bar, The Copper market is working on 3 solid weeks’ worth of gains. The spike low that occurred earlier this month intersected nicely with long-term trendline support and long-term moving average support. The blue trendline at the bottom of the chart is drawn off of the September ’22 and October ’23 lows and is valued near 4.1400 today. The 200-week and 100-week averages (purple, grey, 4.1538 and 4.2291, respectively) are both still inclining higher. You might notice that they made a bullish crossover in the first week of February. The short-term averages of the 5-and 10-week variety, (blue, red, 4.7769 and 4.7994) are making a bearish crossover this week, but I think that might just be a function of having one really “bad” week. We still have 3 trading days for that crossover to flip back up. Stochastics are slightly above mid-range and have a long way to go before hitting overbought territory. What do you see on these charts?
Jefferson Fosse Walsh Trading
Direct 312 957 8248 Toll Free 800 556 9411
jfosse@walshtrading.com www.walshtrading.com
Walsh Trading, Inc. is registered as a Guaranteed Introducing Broker with the Commodity Futures Trading Commission and an NFA Member.
Futures and options trading involves substantial risk and is not suitable for all investors. Therefore, individuals should carefully consider their financial condition in deciding whether to trade. Option traders should be aware that the exercise of a long option will result in a futures position. The valuation of futures and options may fluctuate, and as a result, clients may lose more than their original investment. The information contained on this site is the opinion of the writer or was obtained from sources cited within the commentary. The impact on market prices due to seasonal or market cycles and current news events may already be reflected in market prices. PAST PERFORMANCE IS NOT NECESSARILY INDICATIVE OF FUTURE RESULTS. All information, communications, publications, and reports, including this specific material, used and distributed by Walsh Trading, Inc. (“WTI”) shall be construed as a solicitation for entering into a derivatives transaction. WTI does not distribute research reports, employ research analysts, or maintain a research department as defined in CFTC Regulation 1.71.