The information and opinions expressed below are based on my analysis of price behavior and chart activity
January Soybeans

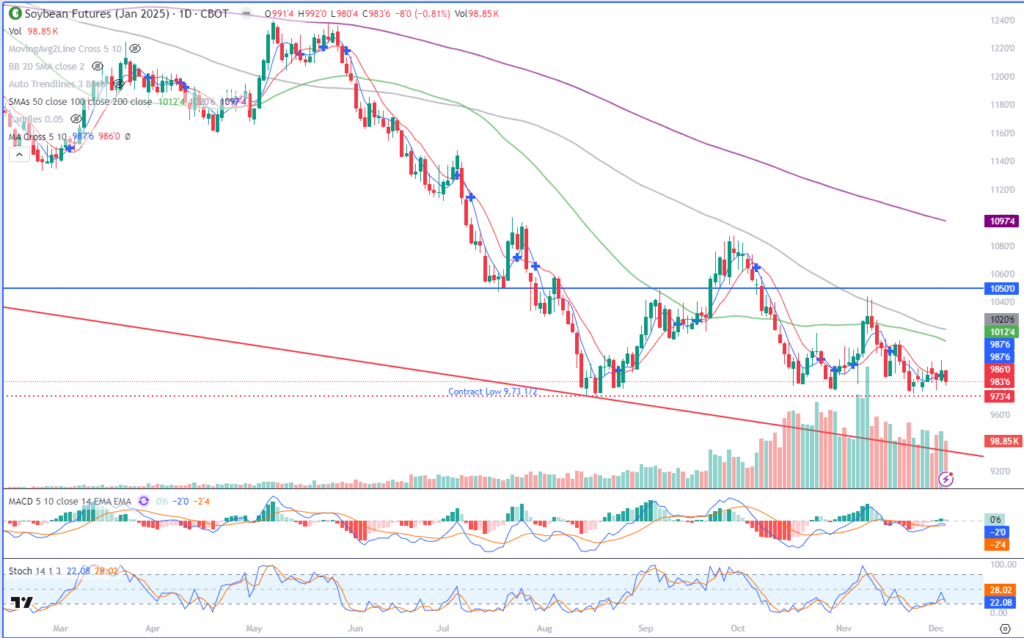
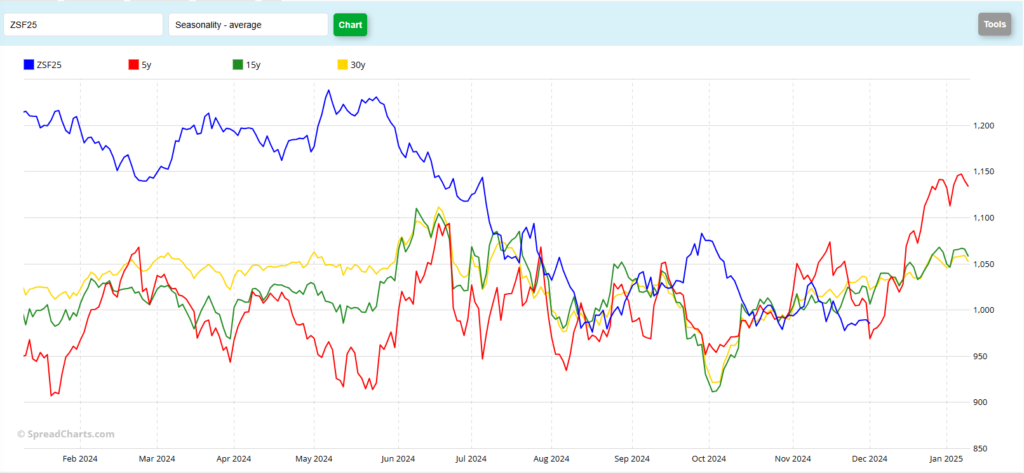
January Soybeans settled the day down 8 cents at 9.83 ¾. Uncertainty over “Trump Tariffs” and what they may, or may not, do to or for US Ag business has market participants on edge. The weather in South America is relatively bearish, as recent rains should support crop development. US Export Inspections are roughly 17% ahead of last year’s pace. Those three sentences highlight the contradiction that is going on in the Soy and Grain markets right now. The first one, regarding tariffs, is currently just a talking point, in my opinion. Yes, Trump has been re-elected and there is always some uncertainty when a new administration comes in. However, he hasn’t been inaugurated yet. Therefore, he hasn’t set any policy now. The noise about tariffs is all speculation, at this point, and is an easy out when people like myself are asked about market conditions. So, the first one, to me, means nothing. The second one, is usually a given. Nearly every year, in every country there’s always concern during planting. Those concerns are valid, because if the rains don’t come in a timely fashion, the crop yields suffer. However, nearly every year, in every country, the rains do come and the crops grow. This year is no different, to my mind. The rains have arrived in Brazil and Argentina and, at this moment, I would expect the crops to grow and progress normally. That is a bearish influence, as South American acreage has increased roughly 3% year to year and 13% above the 5-year average. We just have to wait out the rest of their growing season, and I’m quite confident something will change with production estimates as time goes on. The third sentence, about Export Inspections should be thought of as bullish. At least that’s how I look at it. We are currently exporting more product than this time last year. Demand is good, right? But that’s not the only factor, as those other two sentences are playing a much bigger part, right now. Currently, Beans sit just 10 ¼ cents off of the contract low, set August 14th. You can see it on the chart above with the lower dotted horizontal line in red. The one above it is today’s closing price. The USDA’s last on farm price estimate was right near here at 9.80. That doesn’t “mean” anything, it’s not a guarantee or promise, just an estimate. But prices have been unable to break significantly lower and it almost appears as if there is decent support between 9.75-9.80. Seasonally, I would expect the market to start to turn higher soon, as that’s what the charts indicate (below) However, as you can see by the chart, this has NOT been the year to trade by the seasonals in Soybeans, as there has been divergence throughout most of the year. And the last 5 years may be a bit skewed because of first, COVID, and second the war in Ukraine. Trade during 2021-2023 was not “normal” as we saw rallies of 1.62, .94 and .57 during the month of December in those three years. Those seemed to be unreasonable moves. In my opinion, we’ve been reverting back to what might be considered normal trade and more reasonable price moves. Trendline support (lower red horizontal line) is way down near 9.35 today. I think it’s unlikely that we head there. But in case we do, producers with unsold or unprotected bushels would be wise to consider Put Options to protect the downside, just in case. I don’t think there’s enough of a carry priced into the market to pay for storage, interest, etc. so most bushels should be sold or priced by now. January options give only 23 days until expiry. If your marketing needs require more time, the March options give you 80 days. Aggressive and well-margined futures traders may do well to recall that we’ve been in a downtrending market in Soybeans all year long and that the “trend is your friend” However, I would suggest that the downward momentum seems to be losing strength. Although if we do break to new lows, I would expect many sell stops to be hit and pressure to increase. The 5- and 10-day moving averages crossed to the bullish side yesterday at 9.87 ¾, but the 50- and 100- day averages are offering some perceived resistance at 10.12 ½ and 10.20 ¾. The 10.00 level (big, fat, round even number) will also offer some resistance, as well. I think it’s interesting that we only saw 7 days in November with a close above 10.00. Seasonally, I still expect a turn higher, but I wouldn’t expect it to be a very large move at this point.

Jefferson Fosse Walsh Trading
Direct 312 957 8248 Toll Free 800 556 9411
jfosse@walshtrading.com www.walshtrading.com
Walsh Trading, Inc. is registered as a Guaranteed Introducing Broker with the Commodity Futures Trading Commission and an NFA Member.
Futures and options trading involves substantial risk and is not suitable for all investors. Therefore, individuals should carefully consider their financial condition in deciding whether to trade. Option traders should be aware that the exercise of a long option will result in a futures position. The valuation of futures and options may fluctuate, and as a result, clients may lose more than their original investment. The information contained on this site is the opinion of the writer or was obtained from sources cited within the commentary. The impact on market prices due to seasonal or market cycles and current news events may already be reflected in market prices. PAST PERFORMANCE IS NOT NECESSARILY INDICATIVE OF FUTURE RESULTS. All information, communications, publications, and reports, including this specific material, used and distributed by Walsh Trading, Inc. (“WTI”) shall be construed as a solicitation for entering into a derivatives transaction. WTI does not distribute research reports, employ research analysts, or maintain a research department as defined in CFTC Regulation 1.71.
