The information and opinions expressed below are based on my analysis of price behavior and chart activity
Wednesday, January 8, 2025
February Live Cattle

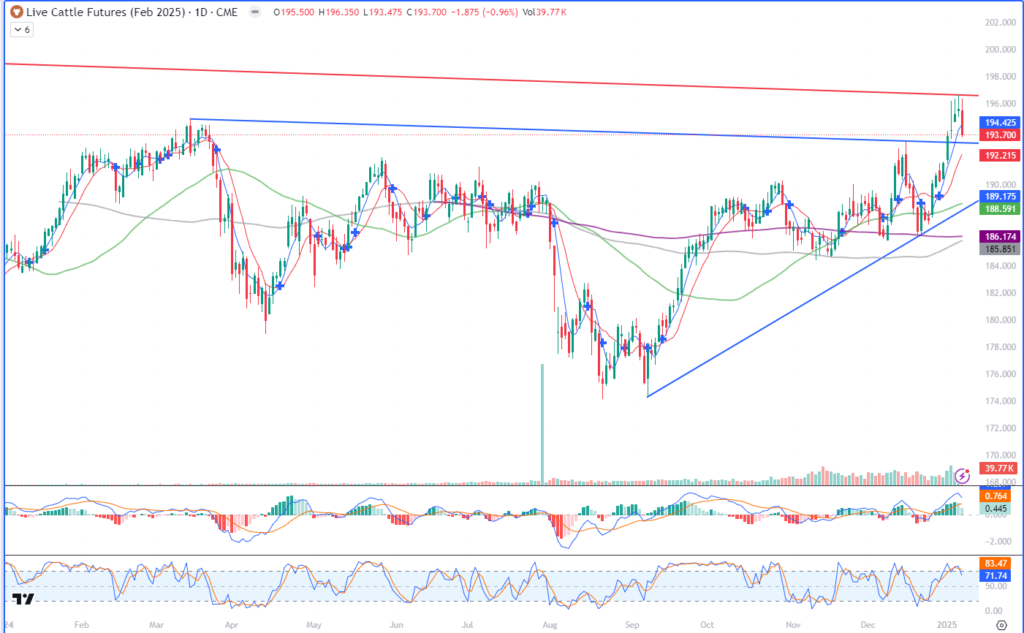
Today, February Live Cattle closed at 193.70, down 1.875 on the day. This is just the second “red” or down day since Christmas, but it was a much larger move than the last down day, Dec 30th. You may notice, by looking at the chart above, the large “wicks” at the top of the last four sessions, including today. That usually indicates to me that there is selling pressure, in this case near and around the 196.00 level. Those long wicks are telling you that the market traded up to those prices, but could not sustain them. Yesterday, the market set a new 15-month (-ish) high at 196.625, prices this contract hasn’t seen since October 13th of 2023. The contract high was set about a month earlier than that, trading up to 199.570 on September 20th of that year. In fact, the upper red trendline is connecting the contract high and yesterday’s high. That may offer some resistance, along with the contract high, should the market trade up there. This past Friday, this chart posted a Doji on my Candlestick charts, with a high of 196.200 and a low of 193.400. It was a textbook doji, too, opening and closing at 194.050. As I wrote here yesterday, the bulls had a chance to rally and couldn’t hold the gains. The bears had a chance to push prices down and couldn’t hold that either. So, the market came back to where it started. We’ve seen prices exceed the high end to start this week, as Cattle traded above Friday’s high all three days. We’ve not yet seen prices test that low. My typical approach when seeing a doji is to allow the market to trade within the range established by the neutral day, placing stop orders to enter the market. In other words, place a buy stop in the futures above 196.200 and a sell stop below 193.400. Not AT those numbers, but above/below them. How much above or below is a personal risk measurement and should be based on your own needs, capital and analysis. In other words, let the market “find” a direction and enter then, rather than trying to impress your own opinion on the market. Traders who are holding long positions right now, may do well to place protective sell stops, if they are not in place already, and try to lock in profits or reduce position risk. Traders who are short, should likely place a buy stop above resistance levels for the same reasons. You’ll also notice on the chart a horizontal blue trendline just below today’s close. I’ve drawn that off of the highs in March and mid-December. That number would be about 193.100 today. That may offer near term support, keeping in mind that Cattle prices have been trending higher since Aug-Sept and that double bottom that occurred in that time frame. The 5-day moving average is above the market, perhaps offering resistance near the 194.425 value. The 10-day average is below the market near 192.215, and the 50-day average is at 189.175 perhaps offering support just above the blue trendline which looks to be near the 188.000 mark today. Stochastics (lower sub-graph) are heading down from overbought territory and the MACD (just above that) is showing signs of momentum slowing. I’m not long-term bearish, at this point in time. I do think the market needs to trade back down a bit, perhaps to trendline support, as the rally during the Christmas-New Year’s weeks was not supported by fundamentals, in my opinion. Overall herd numbers are still declining and I think that is still somewhat bullish, as retail demand remains strong. Until more consumers balk at high meat counter prices, that is.
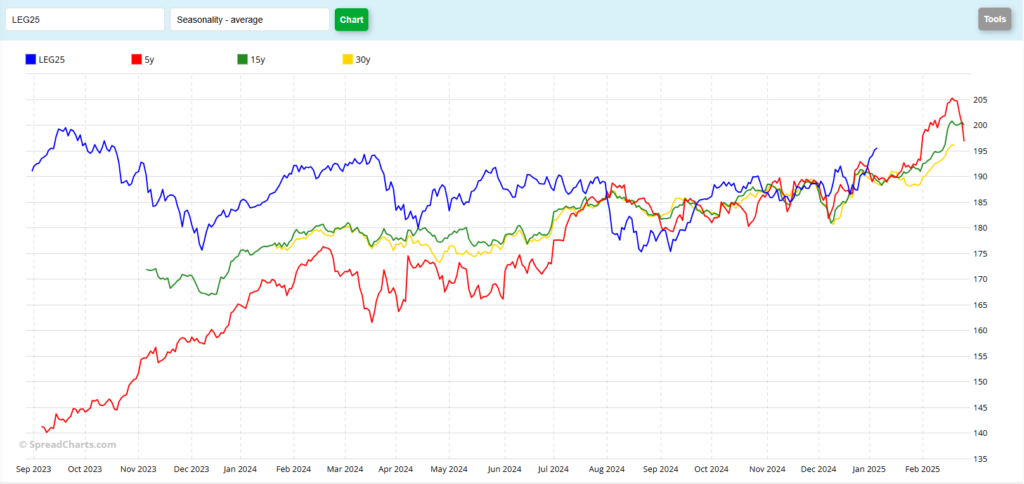
The seasonal chart for Feb Live Cattle (below) show that prices in the past typically trend higher until expiration, but they usually start that rally from below 190.000 and don’t usually accelerate the trend up until the beginning of February, or AFTER the Cattle inventory report that comes out at the end of every January.
The seasonal chart for Feb Live Cattle (below) show that prices in the past typically trend higher until expiration, but they usually start that rally from below 190.000 and don’t usually accelerate the trend up until the beginning of February, or AFTER the Cattle inventory report that comes out at the end of every January.

Jefferson Fosse Walsh Trading
Direct 312 957 8248 Toll Free 800 556 9411
jfosse@walshtrading.com www.walshtrading.com
Walsh Trading, Inc. is registered as a Guaranteed Introducing Broker with the Commodity Futures Trading Commission and an NFA Member.
Futures and options trading involves substantial risk and is not suitable for all investors. Therefore, individuals should carefully consider their financial condition in deciding whether to trade. Option traders should be aware that the exercise of a long option will result in a futures position. The valuation of futures and options may fluctuate, and as a result, clients may lose more than their original investment. The information contained on this site is the opinion of the writer or was obtained from sources cited within the commentary. The impact on market prices due to seasonal or market cycles and current news events may already be reflected in market prices. PAST PERFORMANCE IS NOT NECESSARILY INDICATIVE OF FUTURE RESULTS. All information, communications, publications, and reports, including this specific material, used and distributed by Walsh Trading, Inc. (“WTI”) shall be construed as a solicitation for entering into a derivatives transaction. WTI does not distribute research reports, employ research analysts, or maintain a research department as defined in CFTC Regulation 1.71.
