
The information and opinions expressed below are based on my analysis of price behavior and chart activity
April Live Cattle (Daily)
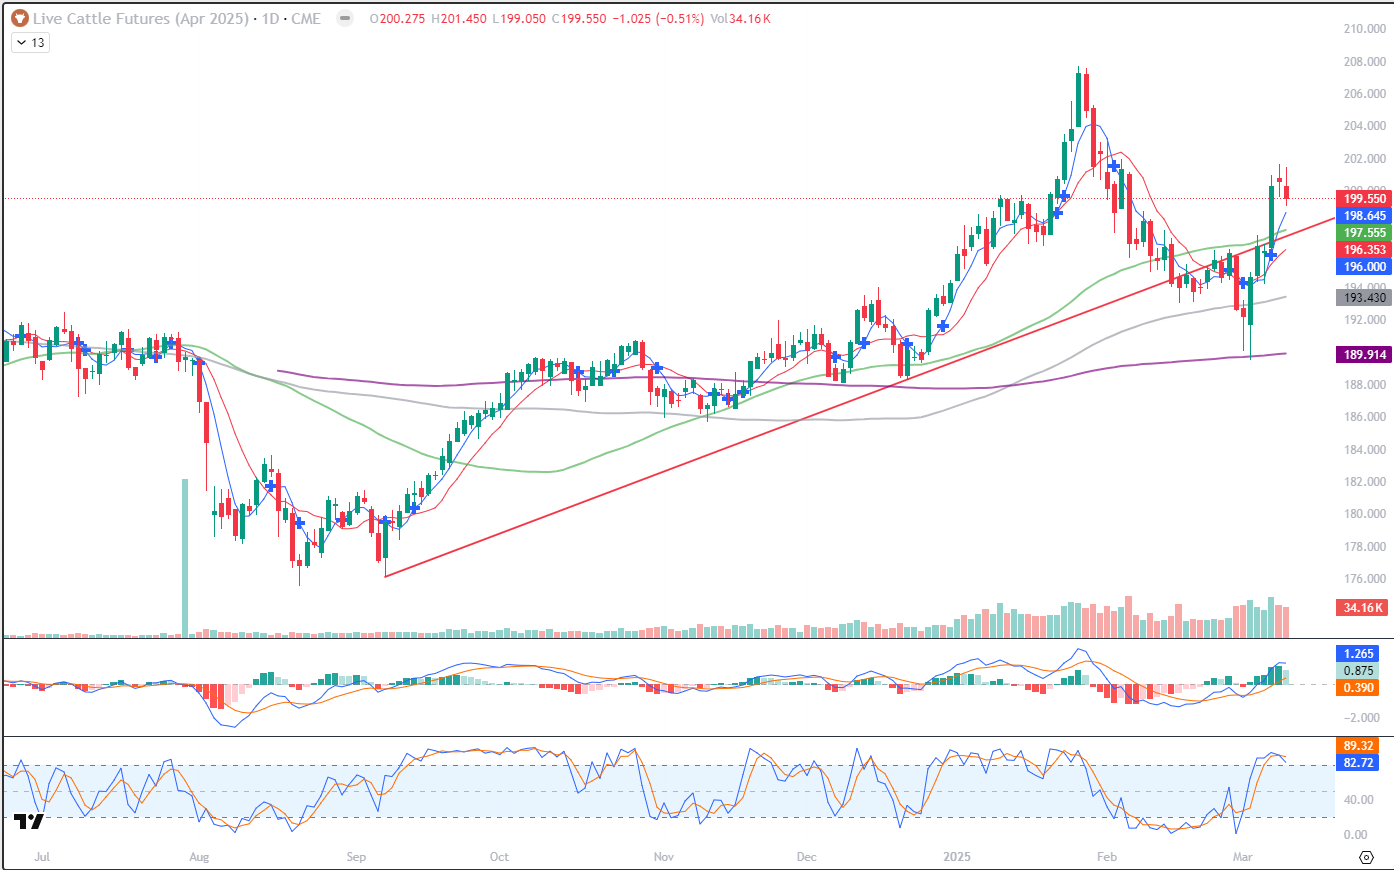
April Live Cattle closed at 199.550 today, down 1.025, posting a lower high and lower low than Monday’s trade. Overall, last week’s trade held support down near the 200-day moving average (purple) and the rally that followed pushed Cattle back into an uptrend as they’re back above the 50-day average (green). Stochastics (bottom subgraph) are in overbought condition but they did hook slightly lower yesterday and today. I’m of the opinion that overbought/oversold is not often an “actionable” “signal, as markets can maintain those conditions for extended periods of time (see last Sept-Oct, most of Jan and also most of Feb) You’ll notice that the 5-and 10-day averages crossed back into bullish territory on Friday, as denoted by the blue cross under Friday’s bar. The market made very sharp gains over 4 sessions and a small pullback is to be expected. I think there is support near the 5- and 50-day averages, (blue, green) 198.645 and 197.555, respectively. If the red trendline (197.175-ish) is broken to the downside, on a closing basis, that could spur a selloff, especially if the 10-day average at 196.353 (red) is broken. That would effectively negate the longs that may have been established since Friday. Overhead resistance on the daily chart might be found at 200.000 (big, fat, round number) or Monday’s high at 201.650. Beyond that, maybe near 205.000 and the contract highs near 207.725. As the trend, to my eye, is still up, Aggressive and well-margined traders may do well to buy a dip to the 5-day or 50-day averages, with a risk/reverse at the 10-day support level mentioned above. Cattle producers that are concerned with price risk, may do well to consider put spreads, given the risk-on, risk-off attitude of many markets these days. That way, you have a floor, should prices drop again, but the upside is still open without having to spend a ton a option premium or worry about margin on futures.
April Live Cattle (Weekly)
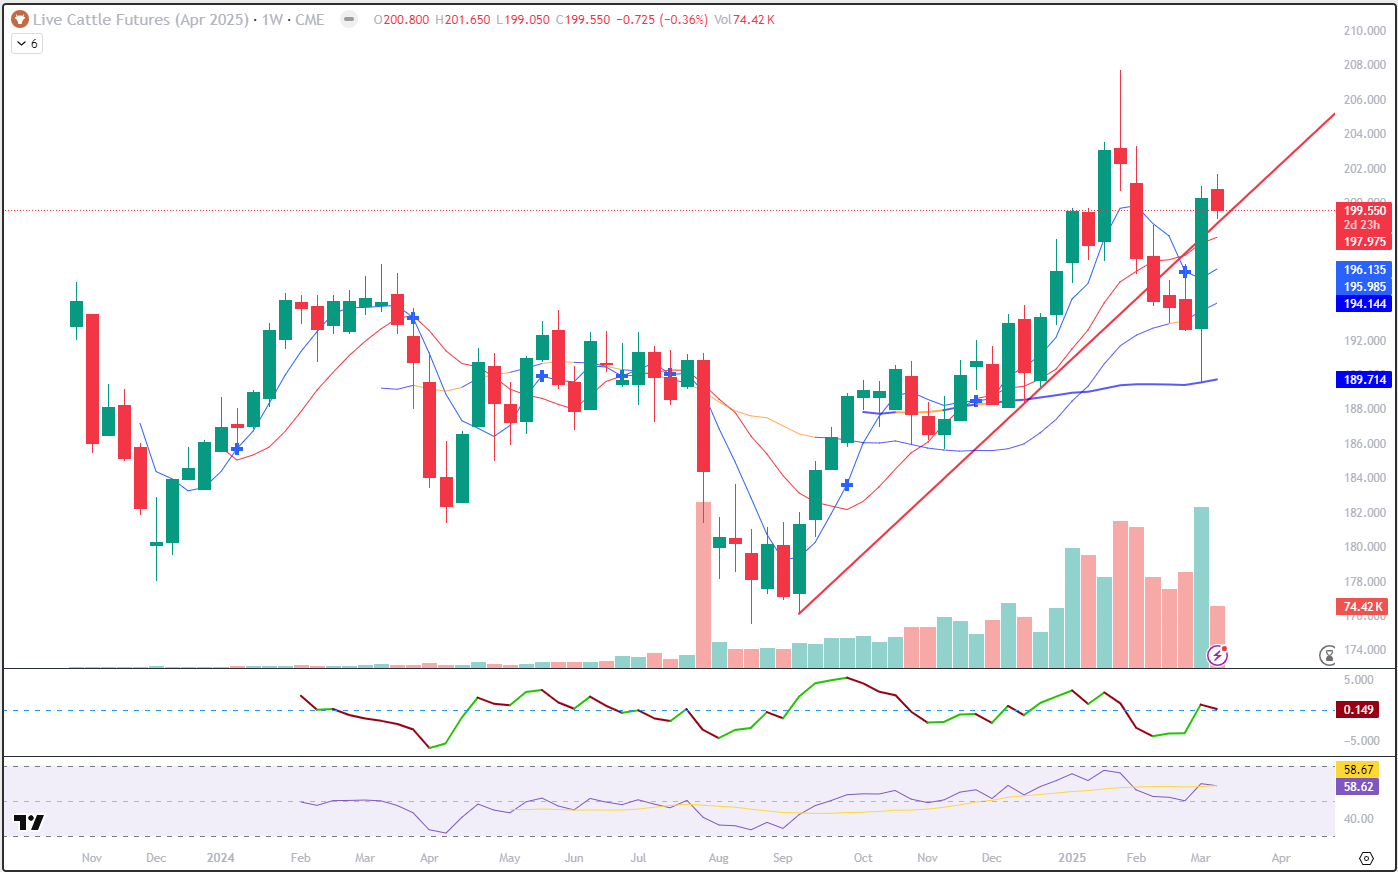
The weekly April Cattle chart clearly shows that large jump in price last week, gaining 7.625 or almost 4%. Prices tested the 50-week moving average (thick blue) and rallied above the 20-, 10- and 5 week moving averages. To my eye, that seems like a strong bullish move and invalidated the bearish trend signal (blue cross) from the week before. This week, so far, Cattle have given back just 0.725, which is not much at all. That red trendline support may hold throughout the week, but I would look for support slightly below that, near the 10-week average, 197.975, or near the 5-week average (thin blue) near 196.135. Overhead resistance may be found near the highs surrounding that spike 7 weeks ago, in the 203.250-203.500 range. Beyond that, 205.000 (fat, round number) and the contract high near 207.725.
April Live Cattle (Seasonal)
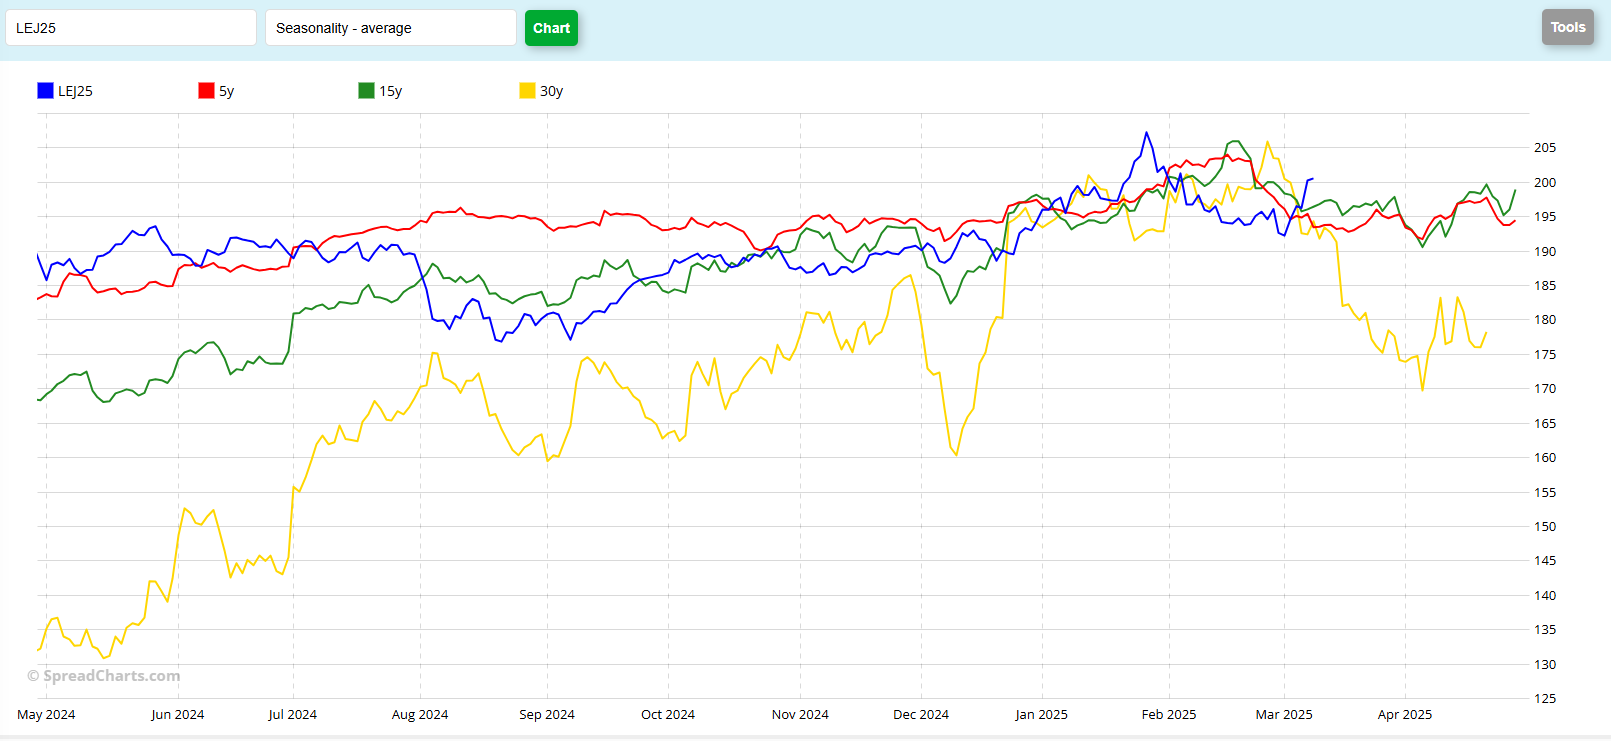
Seasonally, historical data seems to indicate sideways to lower trade, looking forward. The 30-year historical (yellow) seems to show a 36.000 drop from the highs in late Feb to the lows in early April. But the 5 and 15 year patterns seem to show trade between 200.000 and 190.000 from here to expiry. However, you’ll notice that current prices (blue) are trading above the historicals and have turned back up, counter to what would “normally be expected” That seems to track, as there is little going on in the world that seems “normal” right now. There is the possibility that this year’s trade has been early in making the peak. This year’s high, so far, occurred roughly 3 weeks before the 5 and 15 year patterns and 4 weeks before that 30-year. If that’s the case, I wouldn’t expect much more in downside pressure as the price drop in February has nearly matched the drop that one might expect from here until expiration. What do you see?
Jefferson Fosse Walsh Trading
Direct 312 957 8248 Toll Free 800 556 9411
jfosse@walshtrading.com www.walshtrading.com
Walsh Trading, Inc. is registered as a Guaranteed Introducing Broker with the Commodity Futures Trading Commission and an NFA Member.
Futures and options trading involves substantial risk and is not suitable for all investors. Therefore, individuals should carefully consider their financial condition in deciding whether to trade. Option traders should be aware that the exercise of a long option will result in a futures position. The valuation of futures and options may fluctuate, and as a result, clients may lose more than their original investment. The information contained on this site is the opinion of the writer or was obtained from sources cited within the commentary. The impact on market prices due to seasonal or market cycles and current news events may already be reflected in market prices. PAST PERFORMANCE IS NOT NECESSARILY INDICATIVE OF FUTURE RESULTS. All information, communications, publications, and reports, including this specific material, used and distributed by Walsh Trading, Inc. (“WTI”) shall be construed as a solicitation for entering into a derivatives transaction. WTI does not distribute research reports, employ research analysts, or maintain a research department as defined in CFTC Regulation 1.71.