
The information and opinions expressed below are based on my analysis of price behavior and chart activity
April Lean Hogs (Daily)
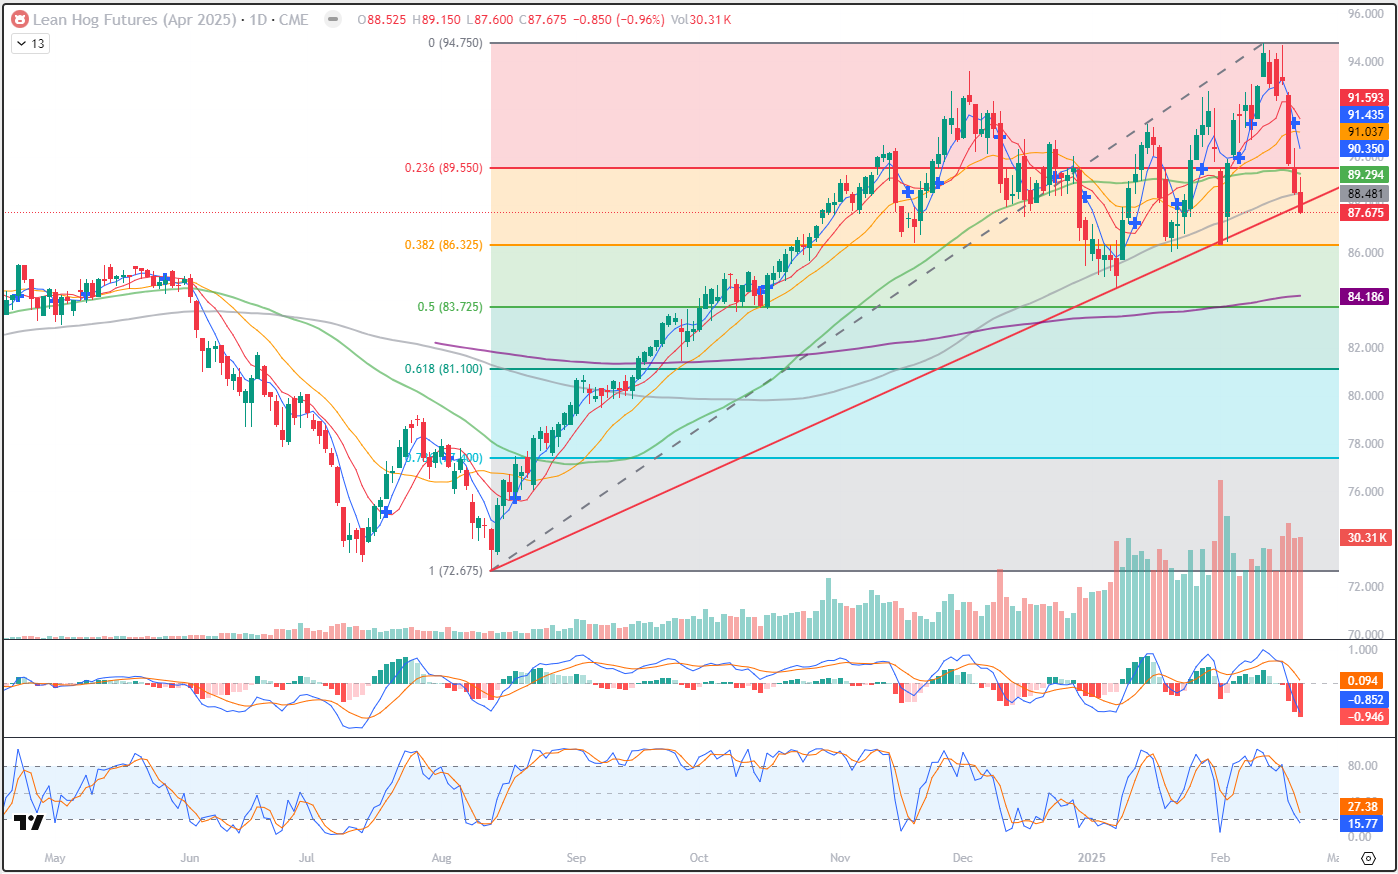
April Lean hogs closed at 87.675 on Friday, down .850 on the day. That strings together 6 “bearish” days together, or day where the close was lower than the open. The April contract started the week higher on Tuesday, got within 2 ticks of last week’s high and failed. This past week saw the market break down through all of the short to medium-term moving averages, leasing only the 200 day (purple, 84.186) unscathed. You might notice the red trendline that I’ve drawn there from the Aug 13th low to the Jan 9th low. Prices closed below it once, on Feb 3rd, before bouncing back up. This is the second time Hogs have closed under that trend, the last time saw that level hold and a push to new highs begin. To my eye, I don’t think that will happen this time. The bears have a running start (6 bearish days in a row) this time, the last was just 2 days of weakness. And while I would normally expect a short reversal following a 6 day move in ANY direction, it appears to me that the volume or selling pressure has been fairly consistent (histogram, bottom of price chart) all week. Stochastics (bottom subgraph) are not into oversold territory yet, but they are pointing down, as is the MACD indicator just above that. The close below trend line support, assuming the market holds that resistance, sets up the chart for a move to the 38% Fibonacci retracement at 86.32, which is also very close to the Feb 3rd low. Beyond that, the May/June highs from last year may offer support near 85.500 or so, and then the purple 200-day (84.186 today) average and the 50% Fibonacci retracement at 83.725. The April contract closed below the 100-day average (grey, 88.481) for just the 3rd time since September, on Friday. Thursday saw the 50-day (green, 89.294) breached, along with a bearish crossover from the 5- and 10-day averages. The crossover is denoted by that blue cross in yesterday’s bar and those averages are at 90.350 (blue) and 91.593 (red) respectively, offering resistance levels from here. Aggressive and well-margined traders may do well to consider short positions, with a risk/reverse near the 10-day average, depending on your entry point.
April Lean Hogs (Weekly)
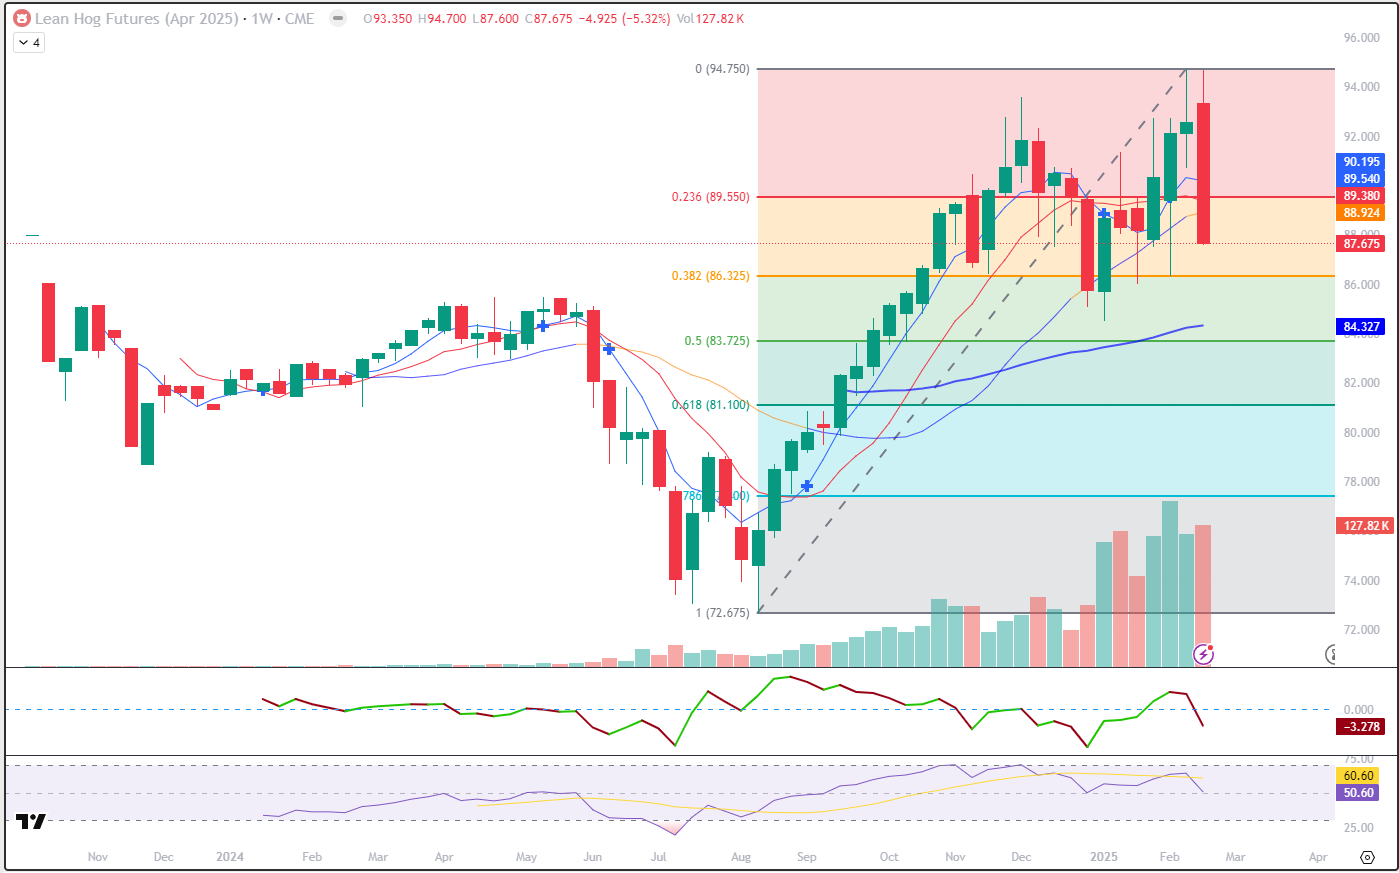
For the week, the April contract closed down 4.925 or a little over 5%. That’s a big move for any market to make in a week. That is the largest move this market has made, up or down, from open to close on a weekly basis. Volume was relatively high for the week, coming in 2nd highest, after two weeks ago. Friday’s close took out the previous 5 weeks of trade activity, as this is the lowest close since the first full week in January. There appears to be a “Tweezer” top between this week and last. You might notice that a similar, but inverted formation occurred at the bottom of the market last July-August. Neither formation has the exact same points as highs (last two weeks) or lows (July-August) but to paraphrase an old saw, “sometimes that’s close enough.” You can see that the market has closed below the 23% Fibonacci retracement at 89.550, with the next level lower being the 38% at 86.325. April futures also closed below the 5- and 10-week moving averages (blue/red, respectively) but there are still in “bullish” territory up near 90.15 and 89.38, respectively. You’ll also notice the close was below the 20-week average (was blue, switched to orange at current bar) which is found near 88.92. Those levels now appear to be resistance, to my mind. The recent weekly lows from the first week in Feb (86.350) and the 3rd week in Jan (86.000) may offer additional support near the previously mentioned 38% Fibonacci level. The 100-week (blue) average at 84.327 and the 50% Fibonacci number of 83.725 would also be support targets just beyond the January low of 84.500. Last May’s high of 85.500 (is that another “tweezer top” there?) could also be a support target if the bulls intend to maintain control of the trend. The Forecast Oscillator (1st subgraph) is pointing lower, as is the 14-period RSI below that.
April Lean Hogs (Seasonal)
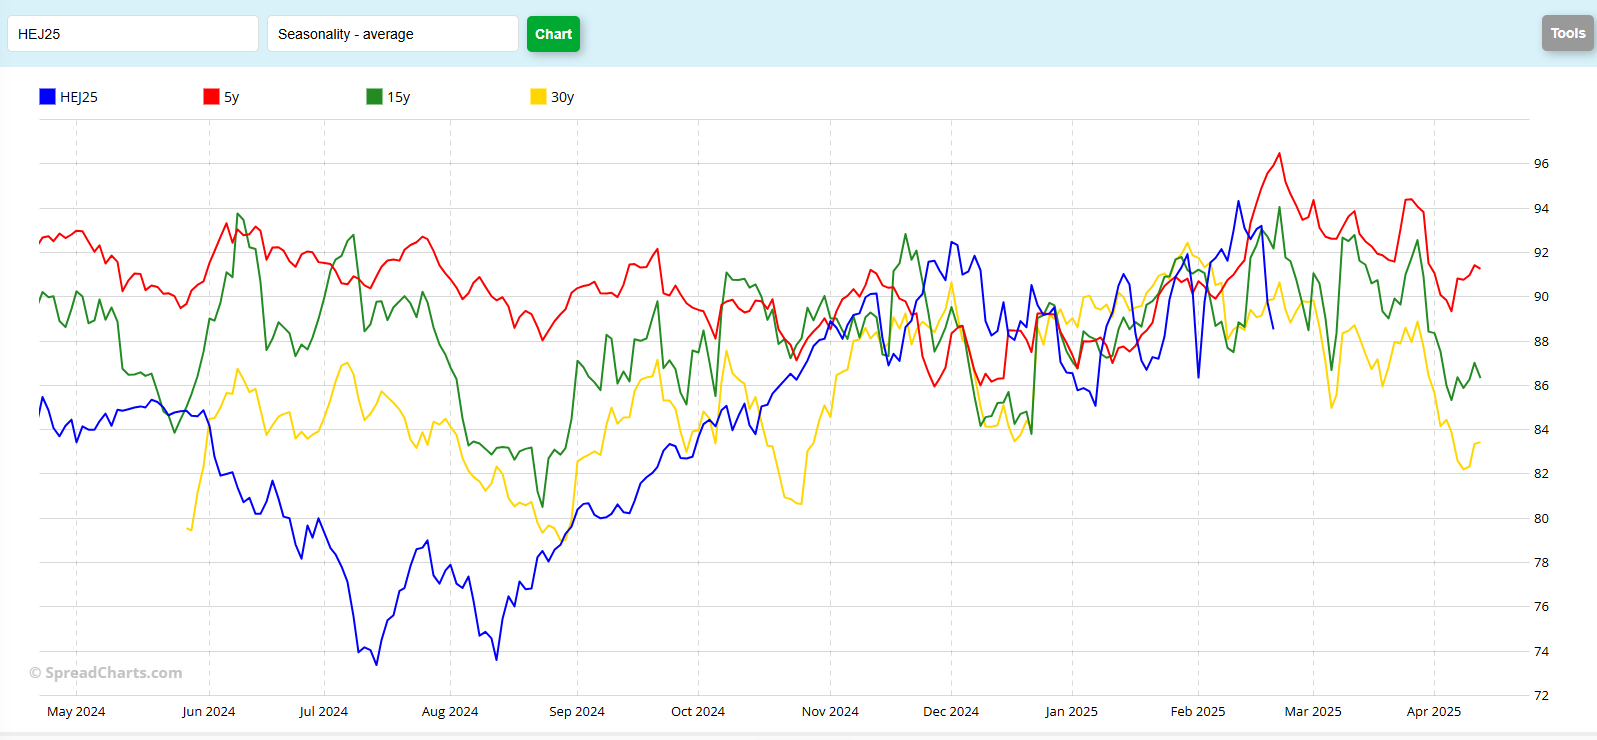
The seasonal chart is a mess, at first glance. But when I look closer at, a few things pop out to me, perhaps you’ll notice them too. First, with the exception of the strong August-December rally, the seasonals patterns track. Yes, the price levels are different, but for the most part, rallies are happening at roughly the “correct” times. Again, with the exception of that rally, the current contract is not diverging, like many of the other commodity markets, to any great effect. The second thing that I see on this chart is that it generally trends lower from now until expiration. The largest declines happen over the longer periods. Thumbnail math indicates a 10.00 decline over the 30-year (yellow), an 8.00 drop over the 15-year (green) and a 7.00 decrease over the 5-year (red) historical pattern. At today’s close (not pictured on the seasonal) the April contract has fallen a little over 7.00. That could mean that Hogs have already made their move lower and are dure for a bounce, or it could also mean that this year’s drop will be larger than the historicals indicate. What do you see?
Jefferson Fosse Walsh Trading
Direct 312 957 8248 Toll Free 800 556 9411
jfosse@walshtrading.com www.walshtrading.com
Walsh Trading, Inc. is registered as a Guaranteed Introducing Broker with the Commodity Futures Trading Commission and an NFA Member.
Futures and options trading involves substantial risk and is not suitable for all investors. Therefore, individuals should carefully consider their financial condition in deciding whether to trade. Option traders should be aware that the exercise of a long option will result in a futures position. The valuation of futures and options may fluctuate, and as a result, clients may lose more than their original investment. The information contained on this site is the opinion of the writer or was obtained from sources cited within the commentary. The impact on market prices due to seasonal or market cycles and current news events may already be reflected in market prices. PAST PERFORMANCE IS NOT NECESSARILY INDICATIVE OF FUTURE RESULTS. All information, communications, publications, and reports, including this specific material, used and distributed by Walsh Trading, Inc. (“WTI”) shall be construed as a solicitation for entering into a derivatives transaction. WTI does not distribute research reports, employ research analysts, or maintain a research department as defined in CFTC Regulation 1.71.