
The information and opinions expressed below are based on my analysis of price behavior and chart activity
April Feeder Cattle (daily)
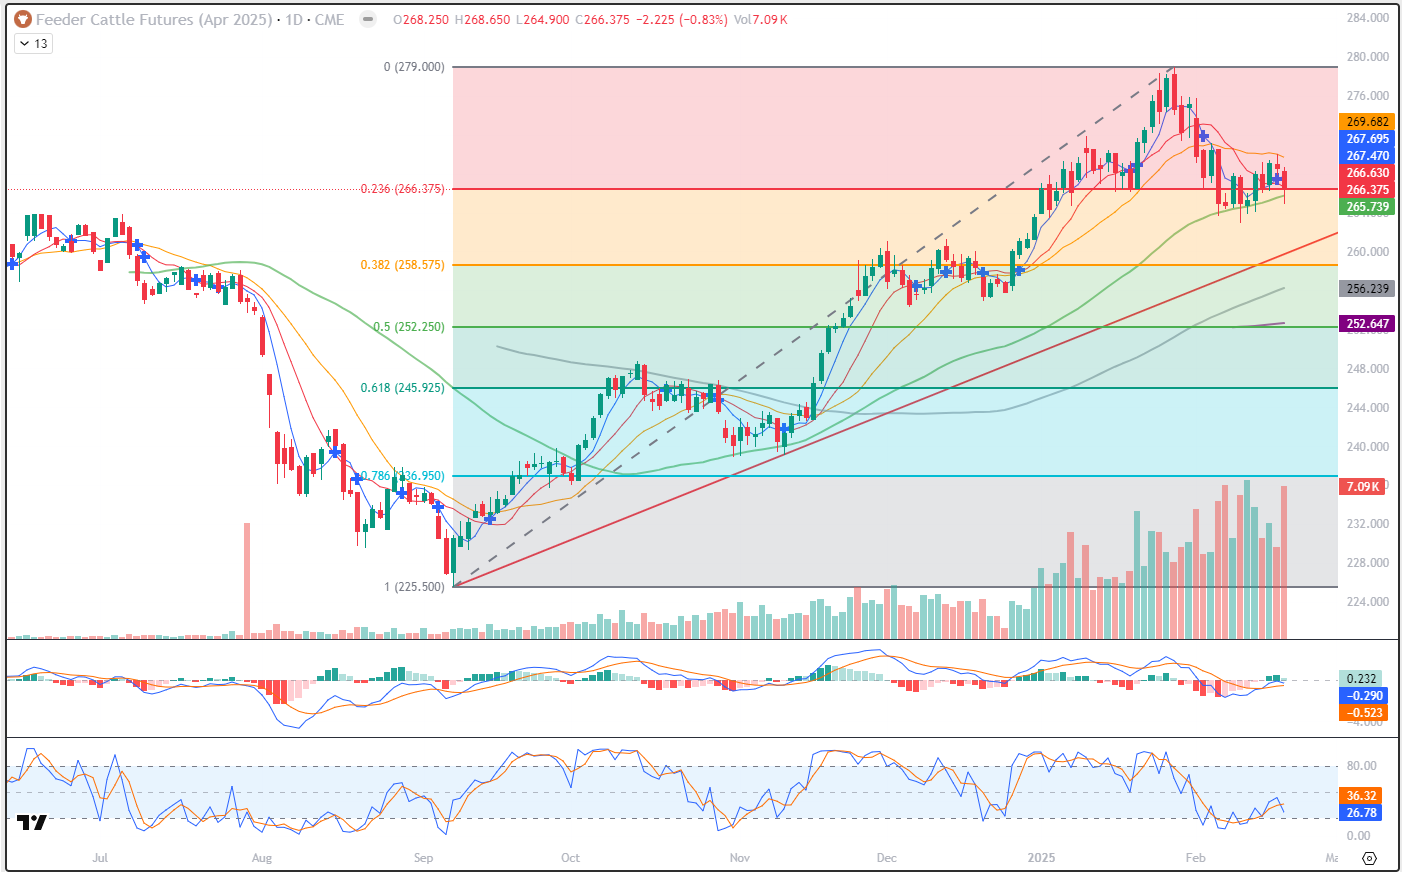
April Feeder Cattle closed at 266.375 today, down 2.225. You might notice, by looking at the chart, that the market has held right along the 23% Fibonacci level for the past 10 sessions. Some of those days have dipped below that level, testing the 50-day moving average (green) which is at 265.74 today. We’ve not yet seen a close below that average, indicating to me that there’s support there. Volume today was high, but some of that may be due to contracts being rolled from March to April. March is still the “front month” but the Open Interest has shifted to April. The 5-and 10-day moving averages (blue and red, 266.695 and 266.630, respectively) flipped back to bullish territory yesterday, as denoted by the blue cross in yesterday’s bar. There is a Cattle on Feed report tomorrow after the close. The daily chart indicates to me that the trend is still up. A close below that 50-day average could change that, but there is still trendline support near 259.850 or so, which is where that value is today. Tomorrows trendline value is at 260.000 or so. Stochastics hooked back down today and are pointing toward price weakness (lowest subgraph) and the MACD, just above that, appears to be weakening, as well. Currently, this chart has something for both the Bulls and the Bears, right now, I think. Bulls might look at this and say “the market is on support, it’s been trending higher, it should be bought” Bears may look at this and say “prices are high, the seasonals project a bearish turn, it should be sold” What do YOU think?
April Feeder Cattle (Weekly)
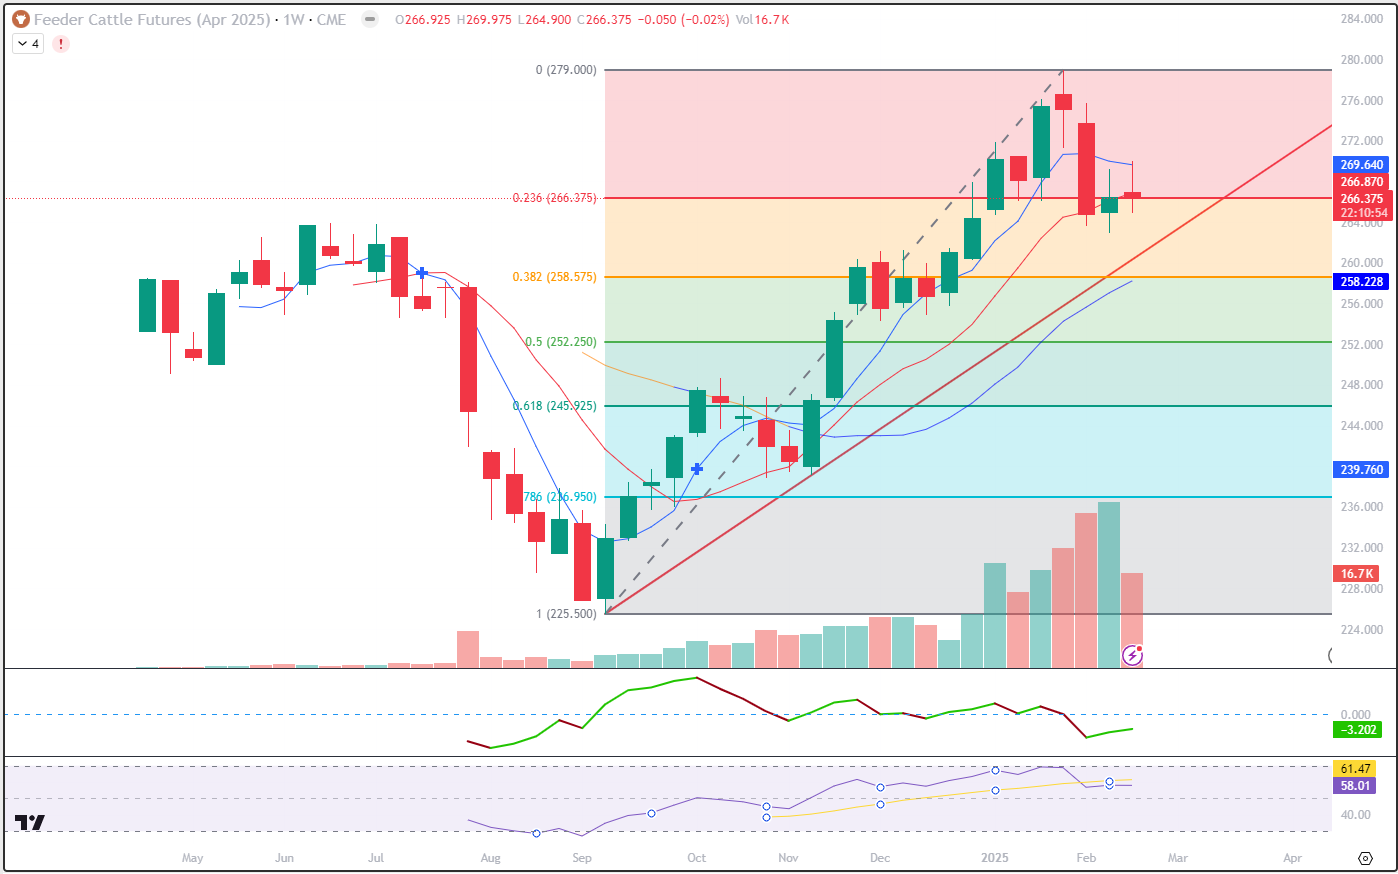
The weekly chart tells me that the uptrend is still intact. The red trendline is drawn off of the September and November lows, and is valued at 265.500, roughly, this week and 262.000 for next. A close below that trend level should certainly turn the trend lower. Today’s close was below both the 5-week average (269.640, blue) and 10-week average (266.870, red) and right on the 23% Fibonacci retracement. We have posted higher highs and higher lows this week, compared to last. The rough midpoint of the highs from last June/July should also offer some additional support near that 261.000 level with the 38% Fibonacci level at 258.575 adding another target.
April Feeder Cattle (Seasonal)
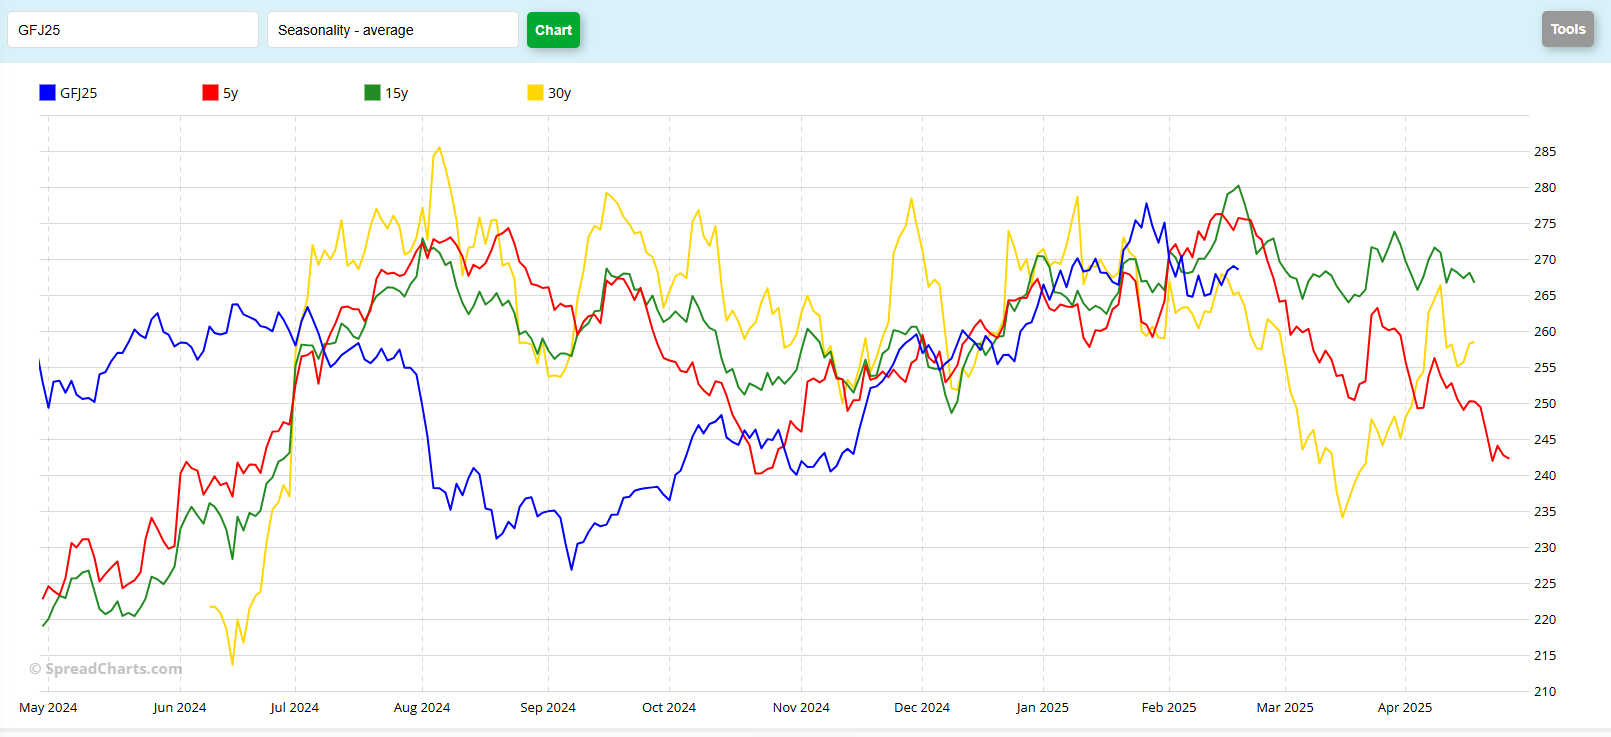
The seasonal chart for April Feeders indicates that prices typically go lower until about the middle of March. While many markets have not been tracking with their seasonal patterns, to my eye, this one has been tracking at least since October. It hasn’t been exact, and we certainly have not seen the volatility that the 30-year historical suggests. It is possible that the historical peak has already happened when the market hit its high in January. If that turns out to be the case, perhaps prices go lower for another week, before bouncing back up.
Jefferson Fosse Walsh Trading
Direct 312 957 8248 Toll Free 800 556 9411
jfosse@walshtrading.com www.walshtrading.com
Walsh Trading, Inc. is registered as a Guaranteed Introducing Broker with the Commodity Futures Trading Commission and an NFA Member.
Futures and options trading involves substantial risk and is not suitable for all investors. Therefore, individuals should carefully consider their financial condition in deciding whether to trade. Option traders should be aware that the exercise of a long option will result in a futures position. The valuation of futures and options may fluctuate, and as a result, clients may lose more than their original investment. The information contained on this site is the opinion of the writer or was obtained from sources cited within the commentary. The impact on market prices due to seasonal or market cycles and current news events may already be reflected in market prices. PAST PERFORMANCE IS NOT NECESSARILY INDICATIVE OF FUTURE RESULTS. All information, communications, publications, and reports, including this specific material, used and distributed by Walsh Trading, Inc. (“WTI”) shall be construed as a solicitation for entering into a derivatives transaction. WTI does not distribute research reports, employ research analysts, or maintain a research department as defined in CFTC Regulation 1.71.