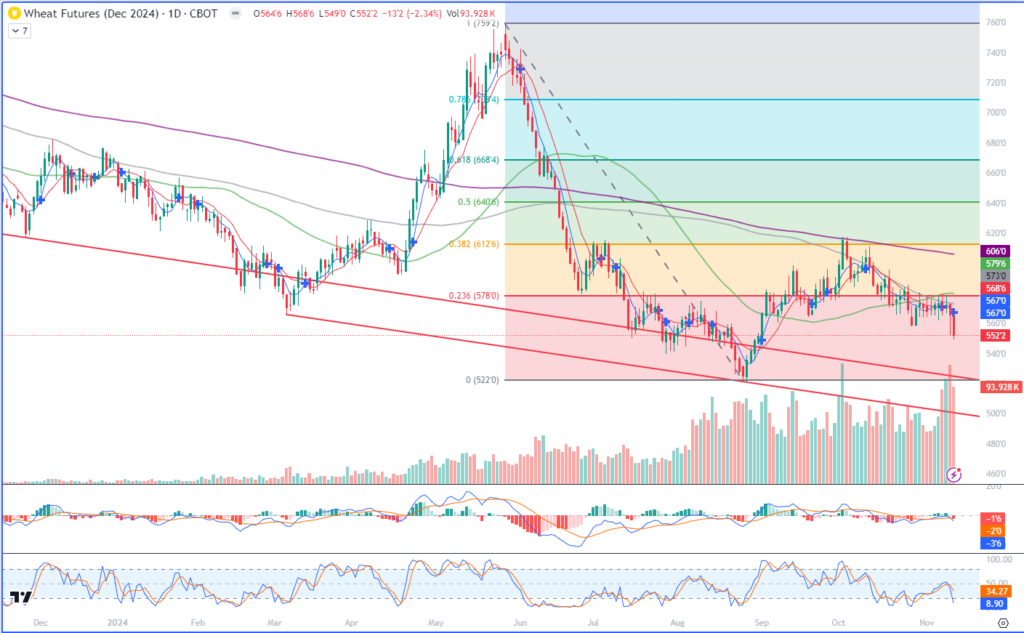
December Wheat
The information and opinions expressed below are based on my analysis of price behavior and chart activity

December Wheat tested the 5.50 mark today, posting a low of 5.49 before settling down 13 ¼ on that day at 5.52 ¼. The week has started on a bearish note yesterday, with prices dropping to 5.51 ¾, before recovering most of the losses and closing at 5.65 ½. At the close on Tuesday, Chicago Wheat is down 20 ¼ cents on the week. As you’ll notice from the chart above, today’s activity pushed the market to it’s lowest close since August 30th, seemingly breaking out of the consolidation range that prices have stayed in for the past three weeks. To my eye, this is not bullish or friendly for prices. On my chart, the 5-and 10-day moving average also crossed into “bearish” territory today. There are 2 long term trendlines (red) drawn on the chart, the first connecting the significant lows from May and November of 2023. This one extends back to the left of the chart. The second connects the lows that the December contract posted in March and August of this year. The first would project support near the 5.25 level today, and the second near the 5.00 mark. As time goes forward, those trendline support values will continue to decline. You also may notice that when the market tested the longer-term trend in March and August of this year, it broke through that support level by a fairly significant margin, before recovering. The Wheat producing areas here in TX, OK, KS, NE and MO got some significant rainfall over the past week or so, which seems timely and beneficial for the recently planted winter wheat crop. That moisture improvement is not reflected in today’s Crop Condition report, which still shows a crop that is only 44% in the good/excellent category. The seasonal chart (below) seems to suggest that the current prices (blue) should likely keep declining, as the 15 (green) and 30 (yellow) trends indicate. The past 5 years (red) contain the Covid and Russia/Ukraine war years, which saw some wildly aberrant price behavior, in my opinion. Especially 2022, which saw prices rallying from July until the middle of November. And remember that this is a chart of seasonal tendencies, not seasonal absolutes. Outside influences could change that picture in a hurry.

So if prices continue lower toward the long-term trendline support levels mentioned above, 5.25 and 5.00, how could a producer manage that price risk? First off, aggressive and well-margined traders and hedgers may do well to consider outright short positions in the futures. The 5- and 10-day moving averages are at 5.67 and 5.68 3/4 , respectively blue and red, offering what may be nearby resistance levels. Slightly above that, the 100-day average is at 5.73 (gray) with the 50-day higher still at 5.79 ¾ (green) In my estimation, this market would need to close above 5.80 in order to change the trend and I think that protective buy stops should be placed at the resistance levels I mentioned, based on your risk tolerance and capitalization level. Less aggressive producers might want to consider using March put options, as those still give 101 days until expiration. 5.50 March Wheat Puts closed at 23 ½ cents today, or $1,175 plus commissions and fees. That would leave you with potentially unlimited price protection between now and March expiration. If you’d like to get slightly more aggressive, converting the Put position into a “synthetic short” by selling an out of the money call (equal to or greater in value than the purchased Put), Perhaps a 5.90 March put (closed at 24 ¼ today, $1,212.50 plus commissions and fees) might do the trick, although that will result in a “marginable” trade and some potential risk. If these strategies don’t meet with your outlook, capitalization or specific hedging needs, call me directly so that we can discuss your wants and needs. specifically.
Jefferson Fosse Walsh Trading
Direct 312 957 8248 Toll Free 800 556 9411
[email protected] www.walshtrading.com
Walsh Trading, Inc. is registered as a Guaranteed Introducing Broker with the Commodity Futures Trading Commission and an NFA Member.
Futures and options trading involves substantial risk and is not suitable for all investors. Therefore, individuals should carefully consider their financial condition in deciding whether to trade. Option traders should be aware that the exercise of a long option will result in a futures position. The valuation of futures and options may fluctuate, and as a result, clients may lose more than their original investment. The information contained on this site is the opinion of the writer or was obtained from sources cited within the commentary. The impact on market prices due to seasonal or market cycles and current news events may already be reflected in market prices. PAST PERFORMANCE IS NOT NECESSARILY INDICATIVE OF FUTURE RESULTS. All information, communications, publications, and reports, including this specific material, used and distributed by Walsh Trading, Inc. (“WTI”) shall be construed as a solicitation for entering into a derivatives transaction. WTI does not distribute research reports, employ research analysts, or maintain a research department as defined in CFTC Regulation 1.71.
