The information and opinions expressed below are based on my analysis of price behavior and chart activity
Thursday, November 7, 2024 December Soybean Oil

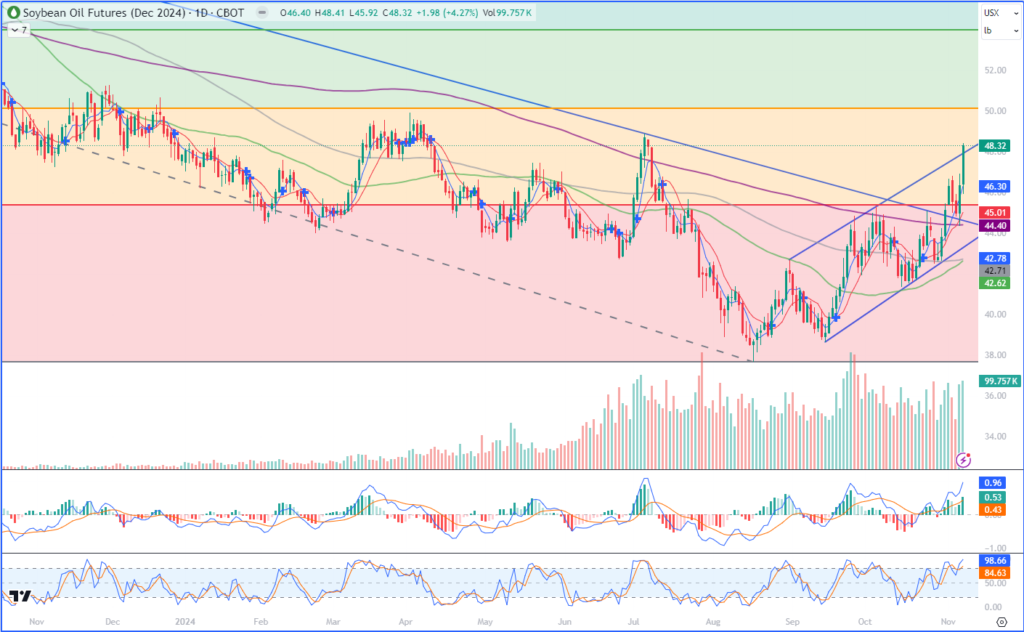
Today the December Soybean Oil contract jumped up 1.98 to close at 48.32, posting it’s highest close since July 5th. Volume was the highest of the week, so far, suggesting to me that there is still new buying interest coming into the market. As you can see by the chart above, prices have broken out above the trendline resistance, drawn from the August and September highs. This contract started off this week with a weaker tone before testing the 50-day moving average yesterday and has rebounded quite well. That 50-day average (purple) also roughly coincided with the with what has been the dominant downtrend, as seen by the downward sloping blue line, which I’ve drawn off the August 2023 high (well off the chart) and the July high, previously mentioned. The next overhead resistance level is that day’s high of 48.89, followed by the 50.00. The high of the year, so far, is at 49.90, set back on April 2nd. I’m of the opinion that markets tend to like big, fat round even numbers. And 50.00 would qualify as that, to my eye. For further reference, the contract high was posted way back in April of 2022 at 70.30. A Fibonacci retracement drawn from that contract high to the August 2024 low pegs the 38% retracement at 50.13 (orange) and the 50% retracement at 53.98 (green) Earlier this week, the 23% retracement level at 45.36 was tested and we’ve seen it rally sharply from there on Wednesday and Thursday. If the market maintains the current momentum, I think both of those upside targets are in play. However, I would be very surprised to see prices head straight up there, without any pullback along the way. Tomorrow at 11 AM CT the USDA will release the December Supply/Demand and Crop Production numbers. I think that the report, along with the fact that prices have gained 6.50 over the past 3 weeks, may inspire a bout of profit taking. I also think that, undamentally speaking, our Soybean Oil prices are likely being pushed higher by Malaysian Palm Oil prices, which have rallied substantially over 7 of the past 8 weeks. There is concern of a shortage of that commodity on the other side of the world and our Bean Oil is a direct substitute or replacement, which could be good for demand. Support levels, to my eye, could be found at the 5-day average of 46.30, along with the 10-day at 45.01 (close to a round number!) and 44.40 which is where the 50-day moving average is. The long-term averages of 100 and 200 days are still barely in bearish territory, but are very close to flipping over to the bullish side, and are both well below the market near 42.75. The MACD indicator (1st subgraph) and Stochastic (2nd) are both pointing higher and the Stochastic, in particular, is very overbought. For those that prefer options, the December 50.00 calls closed at .83 ($498 plus commissions and fees) but only offer 15 days until expiration. That may not be enough time and the January options that expire in 50 days might be a better choice if this market slows down it’s rally. Aggressive and well-margined traders may do well to consider long positions if the market pulls back to support, but keep in mind that first notice day for the December contract is the end of this month, November 29th. If you’d like me to create an approach to this market based on your risk-tolerance and capitalization level, please reach out to me directly.
Jefferson Fosse Walsh Trading
Direct 312 957 8248 Toll Free 800 556 9411
jfosse@walshtrading.com www.walshtrading.com
Walsh Trading, Inc. is registered as a Guaranteed Introducing Broker with the Commodity Futures Trading Commission and an NFA Member.
Futures and options trading involves substantial risk and is not suitable for all investors. Therefore, individuals should carefully consider their financial condition in deciding whether to trade. Option traders should be aware that the exercise of a long option will result in a futures position. The valuation of futures and options may fluctuate, and as a result, clients may lose more than their original investment. The information contained on this site is the opinion of the writer or was obtained from sources cited within the commentary. The impact on market prices due to seasonal or market cycles and current news events may already be reflected in market prices. PAST PERFORMANCE IS NOT NECESSARILY INDICATIVE OF FUTURE RESULTS. All information, communications, publications, and reports, including this specific material, used and distributed by Walsh Trading, Inc. (“WTI”) shall be construed as a solicitation for entering into a derivatives transaction. WTI does not distribute research reports, employ research analysts, or maintain a research department as defined in CFTC Regulation 1.71.
