
The information and opinions expressed below are based on my analysis of price behavior and chart activity
March Corn
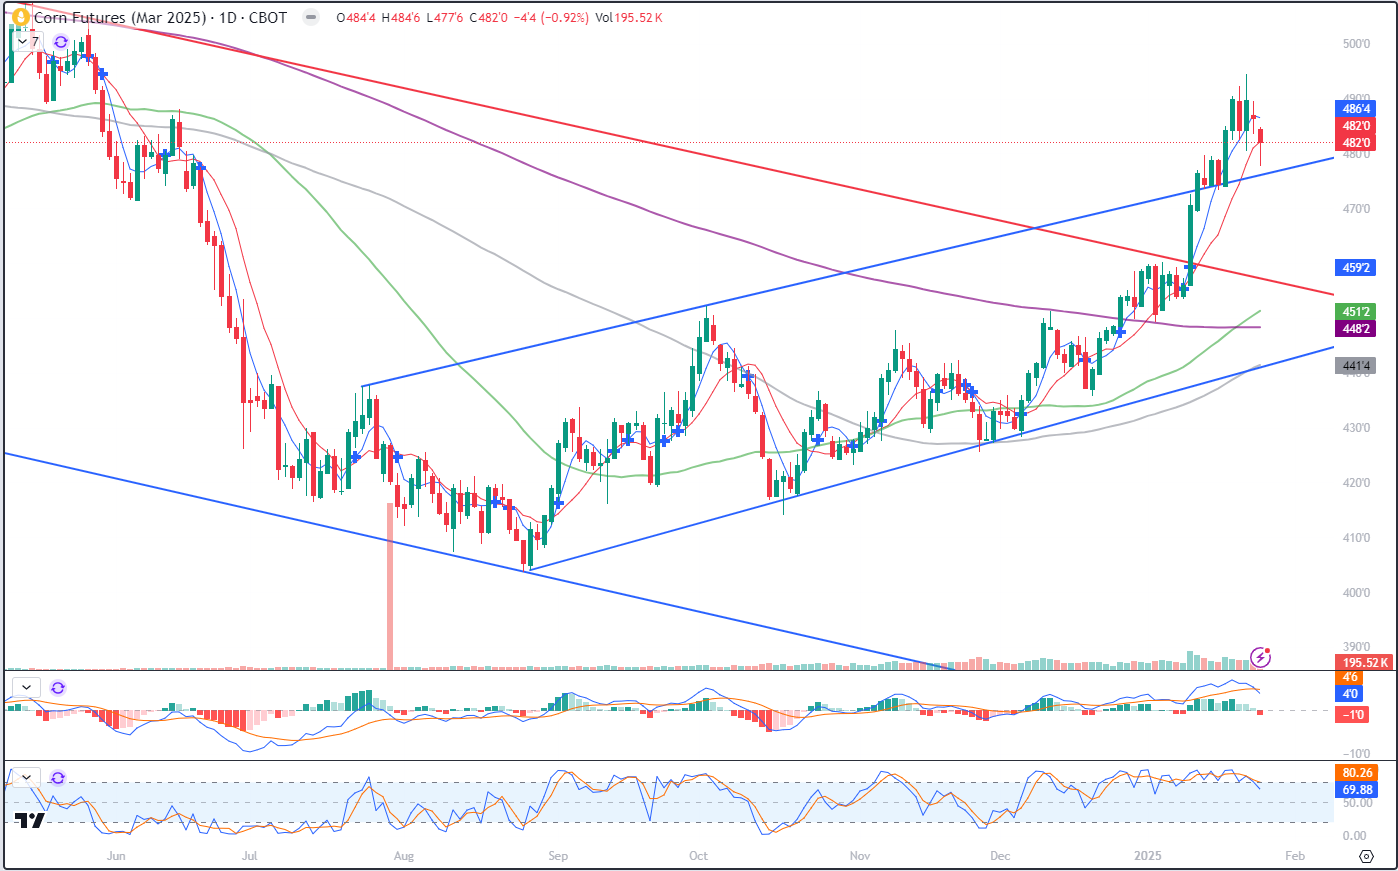
March Corn settled down 4 ½ cents on Monday, closing at 4.82. Last week saw Corn prices touch 4.94 ½, their highest level since May 29th of 2024, setting the weekly high last Thursday. Friday was a relatively quiet down day, as trader took some profits and kept trade inside of Thursday’s 14 cent range. Over the weekend, there was a very brief diplomatic dispute (that, allegedly, didn’t even last 60 min.) between the US and Columbia regarding the return of Columbian citizens that were in the US illegally. The Trump Admin responded with the threat of immediate tariffs of 25%, escalating to 50% within a week. However, the Columbian gov’t quickly reversed their stance and the tariffs will not be levied as long as they remain in compliance. I can understand why people deemed that as bearish, but as the situation was resolved quickly and nothing actually changed, I don’t think it will have lasting effect. The Corn market opened lower last evening, and was on the defensive until about 10:30 this morning. Decent buying interest pushed prices up by the close, settling the market closer to the highs than the lows of the day and right on the 10-day moving average. Coincidentally, the 5-day average is right at Friday’s close of 4.86 ½, which may offer some resistance. There may also be trendline support, just under today’s low, at about 4.76. That’s denoted by the upper blue trendline on the chart above. Overall, my thought is that the uptrend in Corn should continue. However, today’s close below Friday’s range may be unfriendly in the short-term. Friday was nearly a “Doji”, or a day (bar?) that opens and closes at the same price. Typically, when I see that, the next directional close outside of the Doji’s range, I would expect a new directional push. Today we did close under Friday’s range, which would normally indicate weakness ahead. At this moment in time, I don’t expect the trend to shift.
There is decent (not HUGE) demand, both domestically and foreign. A flash sale of 139,000 mt of Corn to Mexico was announced this morning, for example. And I’m hearing more rumblings that the Mexican Cattle embargo may be ending sooner, rather than later, which would also be good for domestic demand. Nothing definite on that yet, but that’s another article when it does happen or is announced. Friday’s Cattle on Feed data, while pegging a slightly lower herd, year-to-year, indicates that feed demand should remain strong, moreso should those cattle be allowed back into the US. The Commitment of Traders report shows that the long side of the market continues to grow, as large speculators added some 32,000 longs last week. South American weather is delaying the Soybean harvest somewhat and thus delaying the planting of the Safrinha crop. In some locations, they may be as much as 10% behind schedule. If their Soy harvest pace is unable to accelerate soon, that may impact the yield for that 2nd crop Corn. Chinese demand will likely slow over the next week, as their New Year begins on Wednesday, with national celebrations lasting about a week, and they tend to not do much business during their Golden Week.
Support levels might be found near today’s low, 4.77 ¾, and then to the previously mentioned trendline near 4.76. 4.75 is also a (relatively) nice, fat round number that may offer support, as well. Resistance might be found near the 5-day average (and Friday’s close) at 4.86 ½, 4.90, which was the high close of last week, last week’s high of 4.94 ½ and the nice, round number of 5.00.
Stochastics turned down today (lowest subgraph on daily chart), but the market has been overbought since before Christmas, and the few times we’ve seen it dip out of overbought status over the past month or so hasn’t resulted in any huge selloff. The MACD (just above the Stochastic) hooked llower today, but again, the times it’s done that over the past month has not pushed prices significantly lower.
March Corn (weekly)
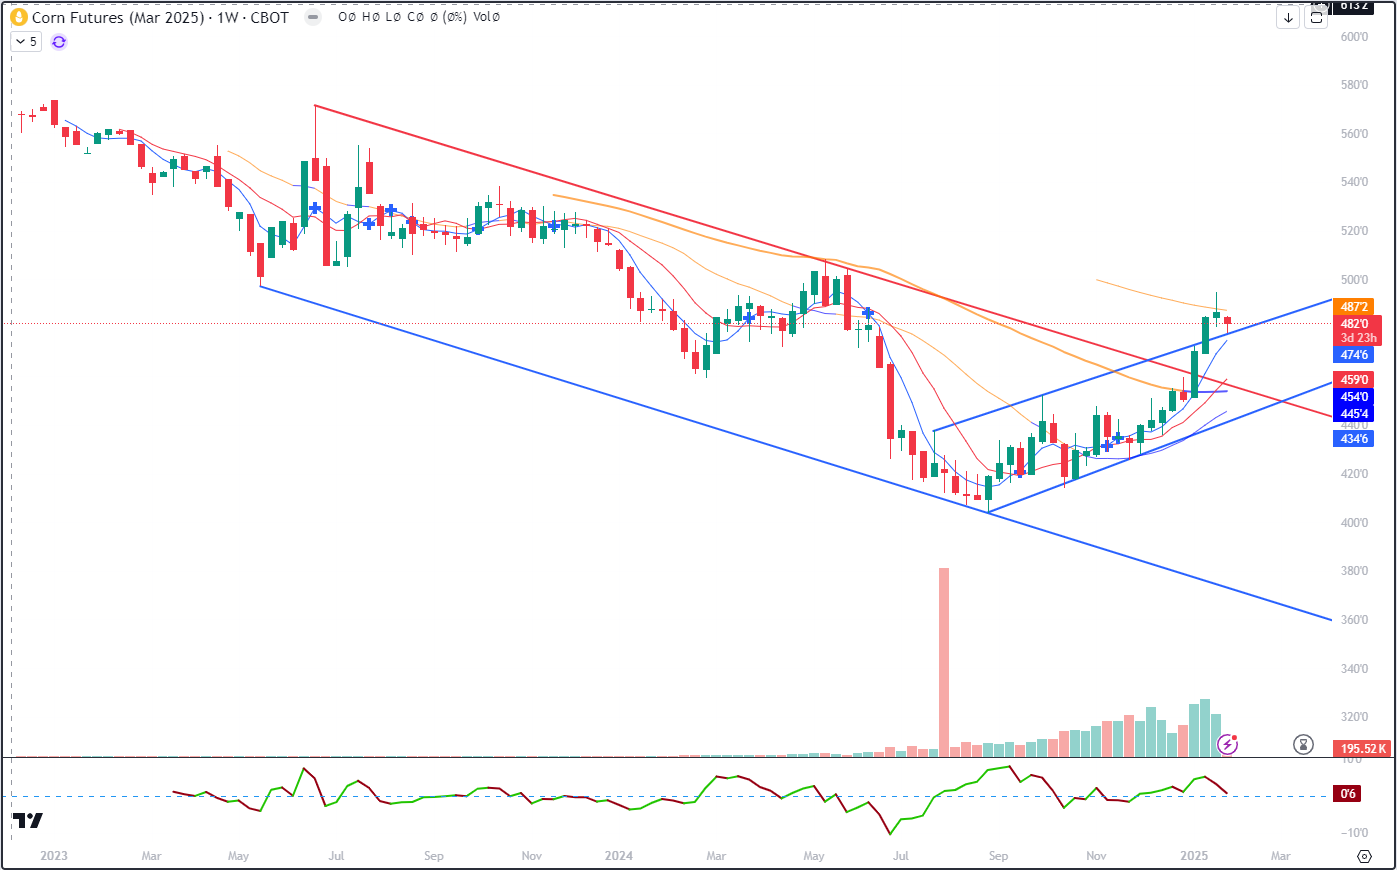
My weekly chart shows that since we made the low in that last week of August (22 weeks, not including this week, it just started) we’ve only had 6 negative weekly closes. The market broke through the downtrend resistance (red trendline) the first week of January. By no means do I think we’re going to set new contract highs or anything like that, but I would expect the high from May to be challenged (5.08 ¼) Unless something comes from outside the market, I would not expect the range from July-Dec of 2023 to be hit. Maybe the low end of 5.09 ¾ is in play down the road, but I don’t think the 5.38 ¼ high is, barring, again, unknown outside influence like tariffs, wars, diseases, etc.
March Corn (Seasonal)
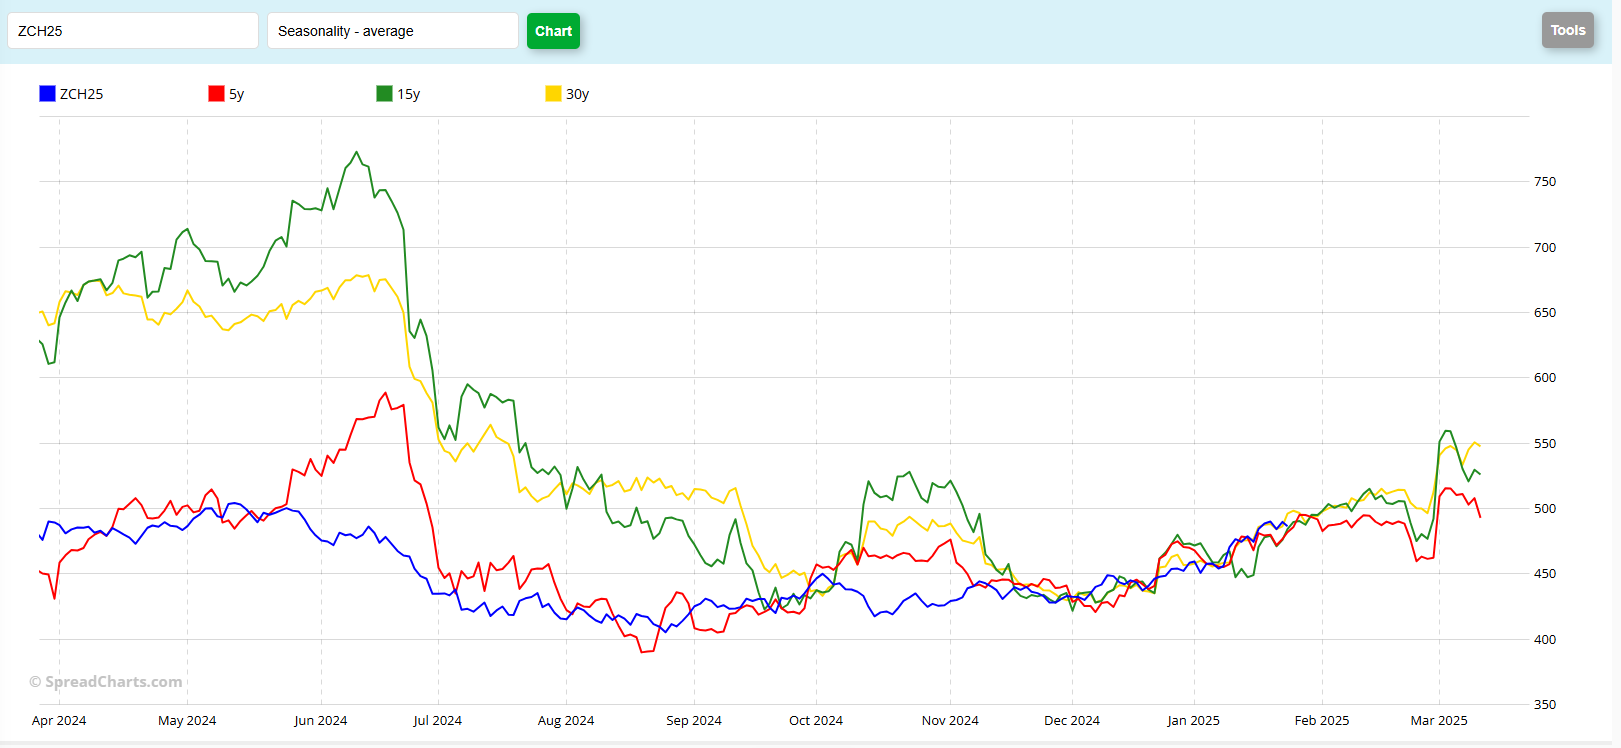
The seasonal pattern indicates to me that perhaps some weakness as we wind up January is possible, followed by a sideways to higher move through mid-February and before contract rollover. At best, the seasonal chart shows a move to about 5.15 before first notice day.
Jefferson Fosse Walsh Trading
Direct 312 957 8248 Toll Free 800 556 9411
jfosse@walshtrading.com www.walshtrading.com
Walsh Trading, Inc. is registered as a Guaranteed Introducing Broker with the Commodity Futures Trading Commission and an NFA Member.
Futures and options trading involves substantial risk and is not suitable for all investors. Therefore, individuals should carefully consider their financial condition in deciding whether to trade. Option traders should be aware that the exercise of a long option will result in a futures position. The valuation of futures and options may fluctuate, and as a result, clients may lose more than their original investment. The information contained on this site is the opinion of the writer or was obtained from sources cited within the commentary. The impact on market prices due to seasonal or market cycles and current news events may already be reflected in market prices. PAST PERFORMANCE IS NOT NECESSARILY INDICATIVE OF FUTURE RESULTS. All information, communications, publications, and reports, including this specific material, used and distributed by Walsh Trading, Inc. (“WTI”) shall be construed as a solicitation for entering into a derivatives transaction. WTI does not distribute research reports, employ research analysts, or maintain a research department as defined in CFTC Regulation 1.71.