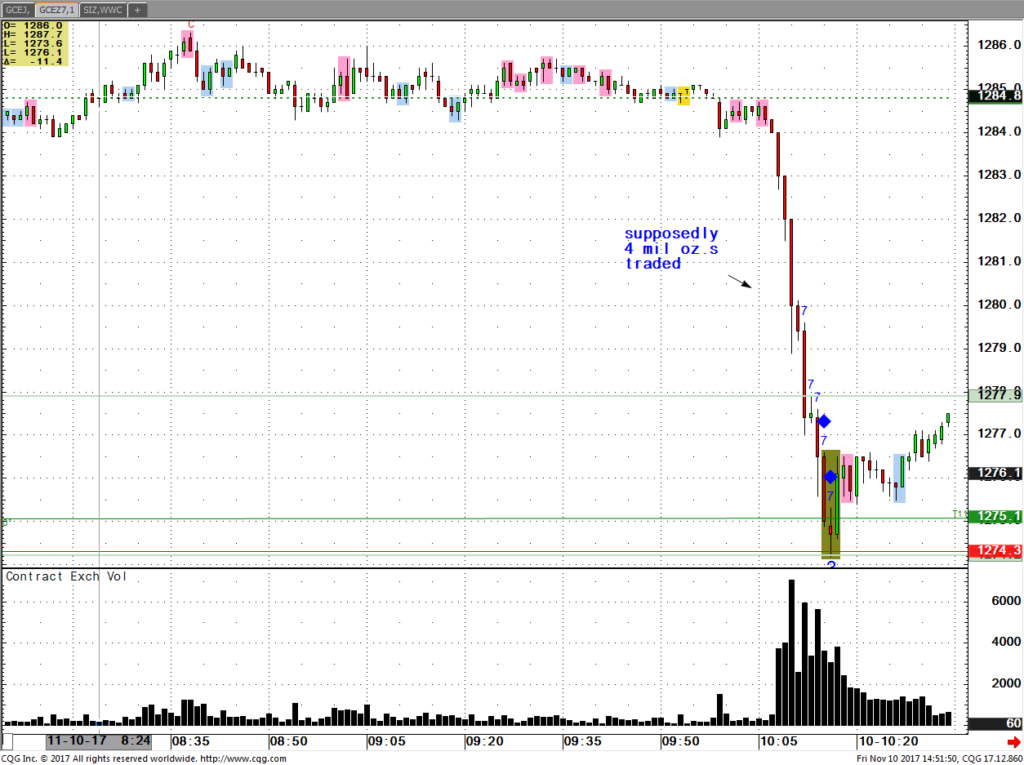
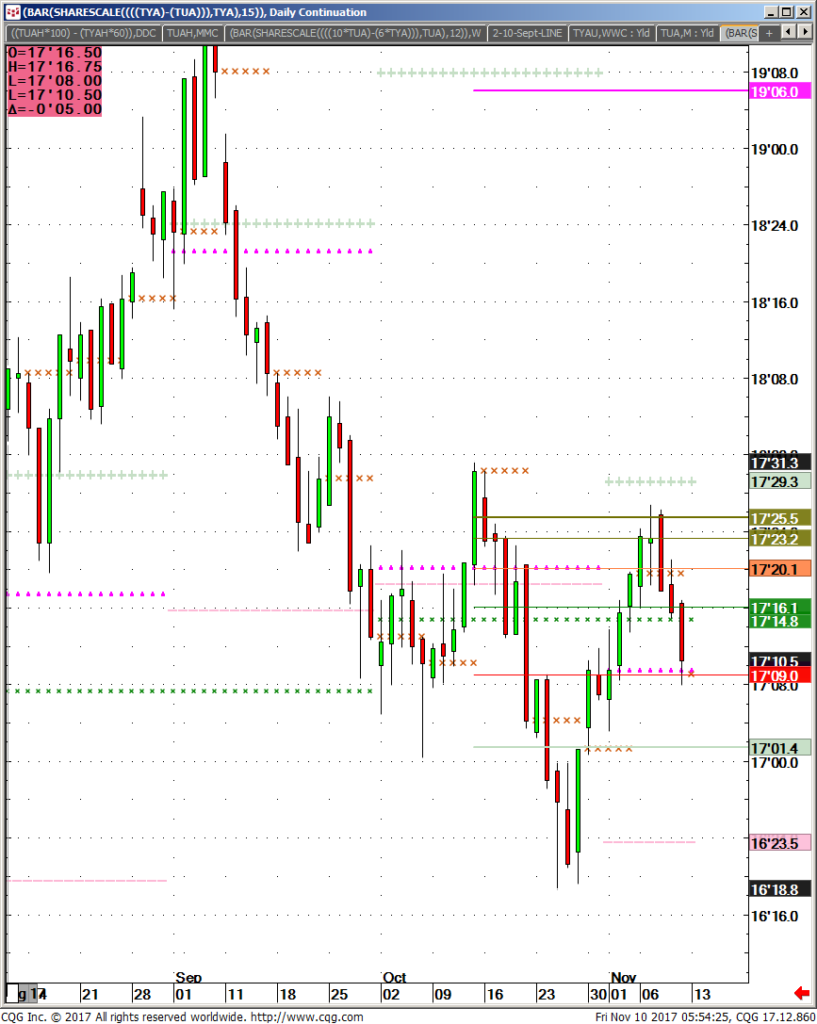
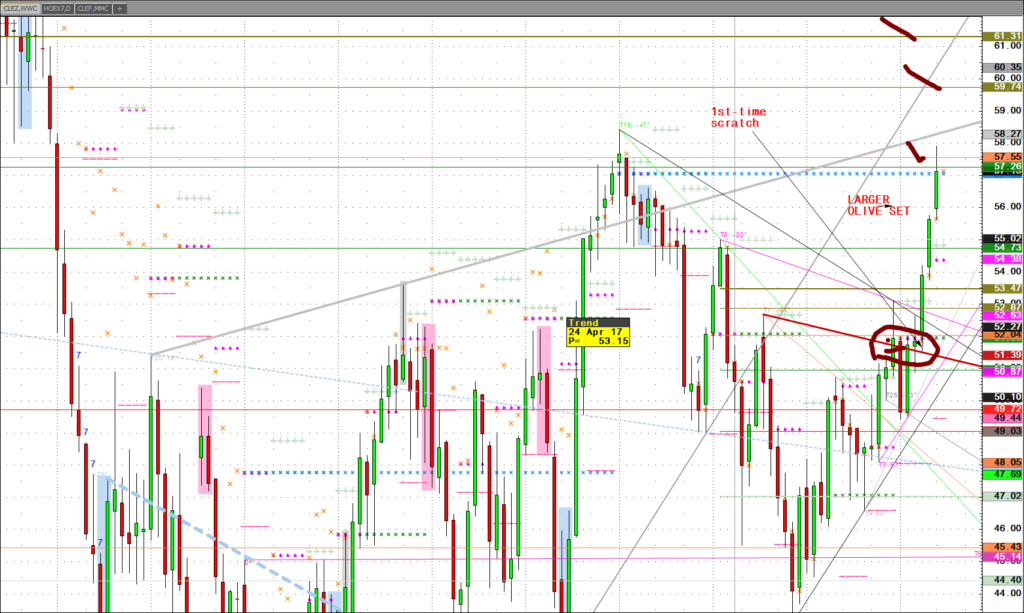
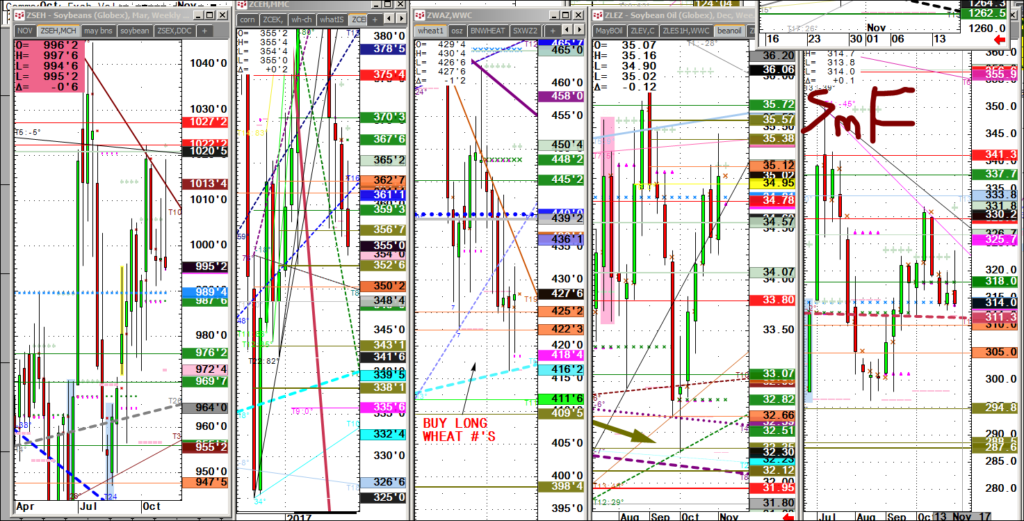
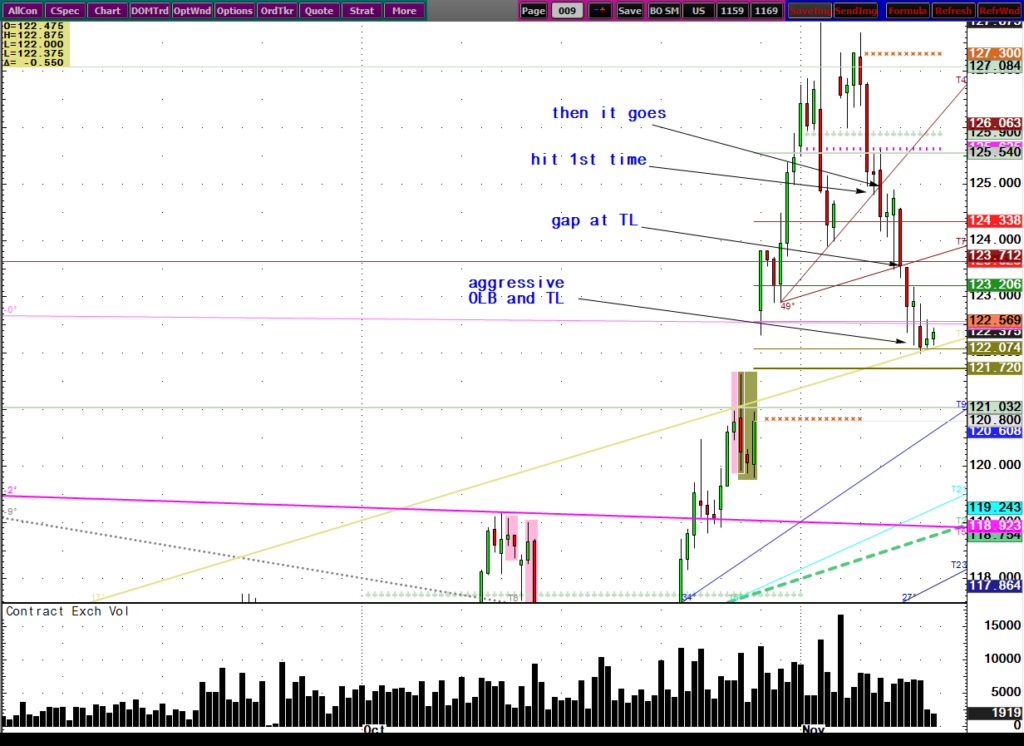
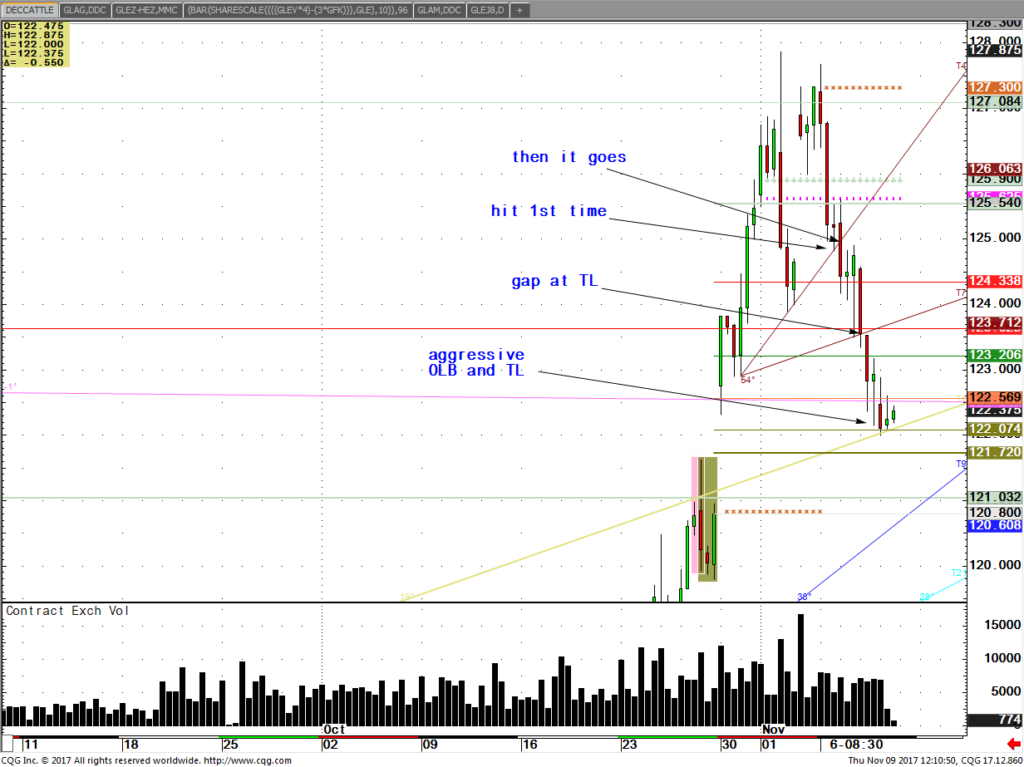
I wanted to drop a few more market charts along your way. Some you may have no interest but my point is to display how I view price action a little differently than most, almost all other brokers. This olive line shows up everywhere and as I have cautioned some crude-oil option Pro traders that over that thick OLS in crude (on way up) we have exploded twice by over 1% in the next bar, off memory. It’s pretty powerful in my opinion how these algo’s whip it around. I keep it simple and it does need an explanation of course.
One market that I have been talking about the last week is a sell level in the bean-wheat spread, 1 by 2. This spread in the last year since February-ish went from all time high around +$2.90 one bean over 2 wheat to minus $1.90-ish up to this and last weeks high of $1.47-ish beans over again. Red lines were only levels I had to sell beans over wheat in this case.
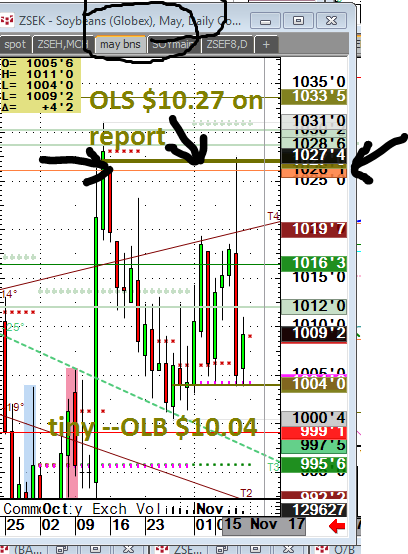
I have opinions of how this is hidden from majority of players that don’t appreciate how these patterns can offer some handsome trading opportunities. My Pro trader buddies included. See my May bean chart, $10.27 and $ 10.04 both hit on USDA. These are tiny but display this algo.
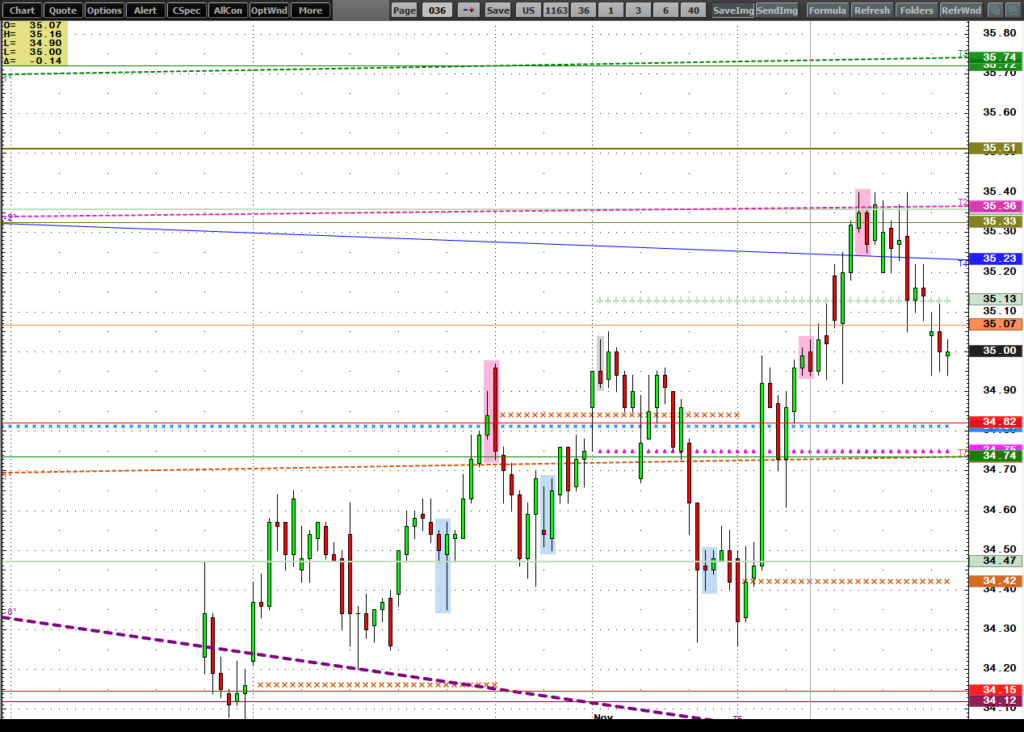
Bean oil broke to 32.32 my OLB,. 8 weeks ago. and this week hit the same OLS (olive line sell) at 35.33. My first client, and student of 3 years, when I used to teach this bought and sold those levels. It was a 10% move in BOZ. I call this an olive line cha-cha when they hit buys and sell. This is the thin OL on the charts and have hit all over the last few months usually before reports.
I will stop here and look forward to giving you my spiel about how I think this can enhance your trading. I am doing a webinar next week and will be a little more detailed on how these trigger points work. Please accept this invitation to register for it. We email a link of it later, viewed anytime.
Imagine having these levels in front of you early and a game plan I suggest to you. Sold !
h
h
h

