
Jon Wiedeman 8/07/2025
If you would like to receive more information on the commodity markets or would like to open an account, please click the link Sign Up Now
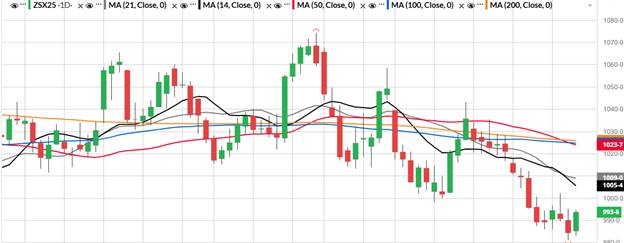
Daily ZSX5:
November beans traded higher on the day with some short covering on temporary oversold conditions. I am still looking at the April 9th low of 971 ¼ as support in the market but we will have to wait and see what the USDA says Tuesday on the monthly supply and demand report. Looking at the daily charts we have the weekly low at 981 ¼ and below that the April 9th low of 971 ¼. Resistance in the market comes at this week’s high of 1002 ¼ and then the 14 day moving average at (1005 ½) the 21 day at (1009). Above those levels the 50day is at (1023 ¾). See chart below.
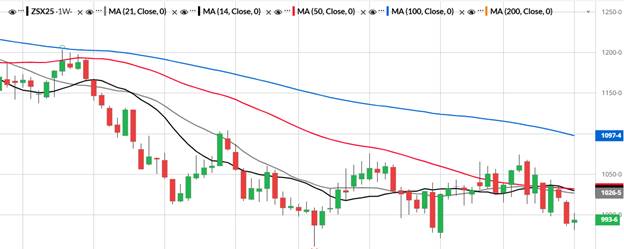
Weekly ZSX5:
Looking at November beans on the weekly charts we have support at 981 ¼ which is yesterday’s low and currently this week low. Below that we have 971 ¼ which is the April 9th low. If we get above last week high of 1018 ¼ in my opinion we are going to test the cluster of moving averages above the market. Those are sitting at 21 day (1026 ½) 14 day (1029 ¾) and lastly 1032 (50 day) see chart below.
Fundamentals:
With no China bean demand soybeans are having an uphill battle, though I do think we could continue to see some short covering going into Tuesdays August supply and demand report. We will have to see how the USDA handles the dismal soybean purchases from China on the report. Private analyst are coming in around 1 bpa above what the USDA is using which is a yield of 52.5. Tomorrow afternoon the commitment of trader report comes out so we will see how the funds are positioned going into the weekend as well, this data is taken from Tuesday’s close though.
Trade Ideas:
I am looking for beans to continue to rally into the report Tuesday and looking to get short at 1026 with a stop at 1031.
Daily ZCZ5:
December corn got below the $4 yesterday and traded down to 396 ¾. It has found some support and now looking to test the weekly high at 412 ¾. With temporary oversold levels in Dec corn, I would expect the market to continue to rally and test this week high of 412 ¾ which coincides with the 14 day moving average at 412 ½ and the 21 day at 415 (see chart below).
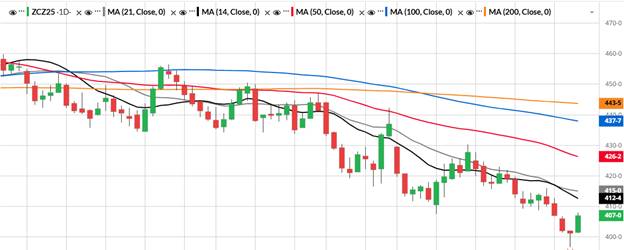
Weekly ZCZ5:
Looking longer term at December corn we have some work to do to get above last week’s high at 419 ¾. With some oversold stochastics and the USDA report Tuesday nothing can be ruled out. Looking at the weekly moving averages we have the 14 day at 431 ¼ and the 21 day at 438 ¾ (see chart below).
Fundamentals:
Export sales this morning topped expectations for the 2025-2026 marketing year, but below estimates for 2024-2025. This morning, we also had two sale announcements 105,00 MT to Mexico and 106,000 MT to Guatemala during the 2025-2026 marketing year. December corn seems to have found some short-term support going into Tuesdays USDA report with putting a low in at 396 ¾. Private analysts are estimating a corn yield of 186-188 compared to the USDA of 181 from last month’s report. In my opinion the USDA could raise the corn yields to the 184 area on Tuesday.
Trade Ideas:
Buying Dec corn at 404 with a stop at 399.
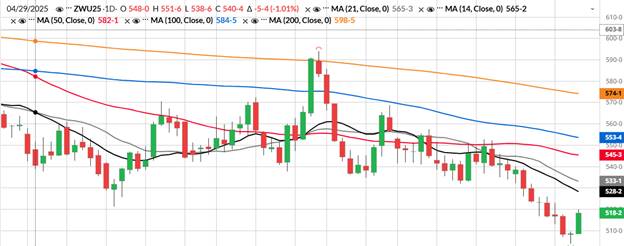
Daily ZWU5:
Wheat closed higher today and has its eye on taking out this week high at 523. I am using this week low as support which is 504 on the daily charts. Above this week high of 523 we have resistance with the 14 day moving average at (528 ¼) 21 day (533) (see chart below).
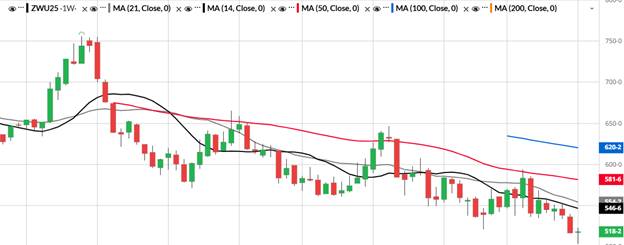
Weekly ZWU5:
Last week’s high was 540 for September wheat and 557 ½ which was the month of July’s high. Resistance is coming in at (546 ¾) which is the 14 day moving average and 554 ½ the 21 day average (see chart below).
Fundamentals:
Wheat found support in today’s trading session after breaking over 30 cents in the past 7 trading sessions. Export sales were above estimates this morning and the USDA is supposed to have a small reduction in all wheat production Tuesday from last month’s report.
Trade Ideas:
With wheat oversold in my opinion I am looking at the December wheat option and buying a 540-580 call spread for 10 cents. We would need a setback of around 5 cents in the futures market to pick that up.
If you would like to receive more information on the commodity markets or would like to open an account, please click the link Sign Up Now

Jon Wiedeman
Pure Hedge Division
Direct: 1 312 957 8108
WALSH TRADING INC.
311 S. Wacker Suite 540
Chicago, Illinois 60606
Walsh Trading, Inc. is registered as a Guaranteed Introducing Broker with the Commodity Futures Trading Commission and an NFA Member.
Futures and options trading involves substantial risk and is not suitable for all investors. Therefore, individuals should carefully consider their financial condition in deciding whether to trade. Option traders should be aware that the exercise of a long option will result in a futures position. The valuation of futures and options may fluctuate, and as a result, clients may lose more than their original investment. The information contained on this site is the opinion of the writer or was obtained from sources cited within the commentary. The impact on market prices due to seasonal or market cycles and current news events may already be reflected in market prices. PAST PERFORMANCE IS NOT NECESSARILY INDICATIVE OF FUTURE RESULTS.
All information, communications, publications, and reports, including this specific material, used and distributed by Walsh Trading, Inc. (“WTI”) shall be construed as a solicitation for entering into a derivatives transaction. WTI does not distribute research reports, employ research analysts, or maintain a research department as defined in CFTC Regulation 1.71.