
The information and opinions expressed below are based on my analysis of price behavior and chart activity
June Live Cattle (Daily)
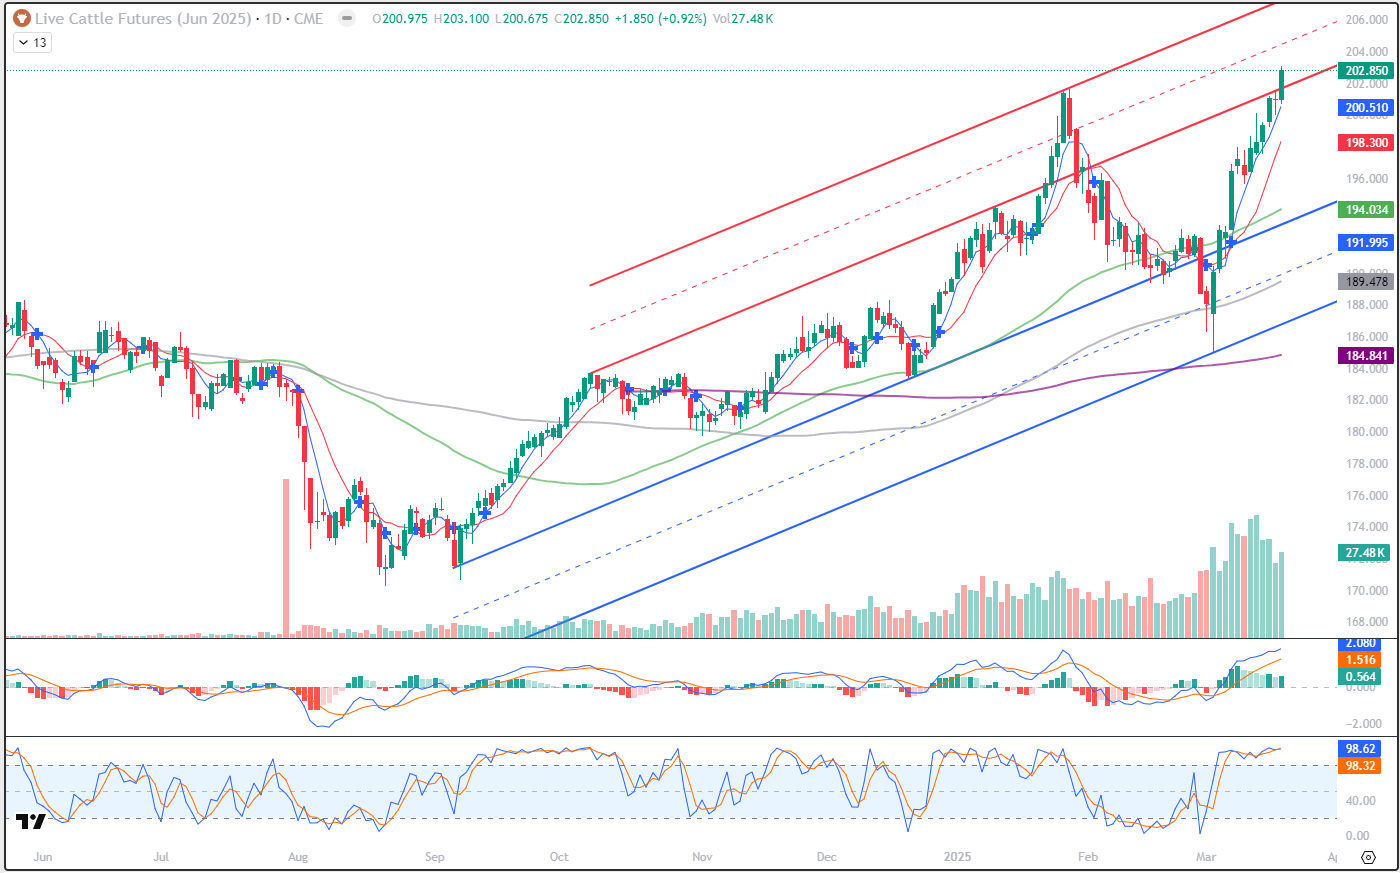
June Live Cattle settled at 202.850 today, up 1.850. This is a new contract high close. Momentum, as measured by the MACD and Stochastic (subgraphs) seems to be strong and both of those indicators are still pointing up. I’ve drawn a couple of trend channels on the chart. The upper (red) is drawn from the highs in the first half of both October and January, with a parallel extension to the previous contract high in late January. That indicates potential resistance near 204.500 and 207.250. Those are the values at today’s close and will move higher as time goes along. From here the fat, round number of 205.000 may also come into play as resistance, as well. The lower (blue) is drawn off of the September and December lows, with the extension to the March 4th low. The first support level from that would appear to be near 193.000, below the 50-day moving average (green) at 194.034. You might see the blue crosses on this chart, with the most recent on March 7th. That indicates a bullish crossover of the 5- and 10-day averages. Yesterday, price activity ended in a Doji, a day that opened and closed at the same price. Today’s bullish close would tell me that traders still expect higher prices. If you’re long this market, perhaps a protective stop between the 5-and 10-day averages would seem appropriate. There is a Cattle on Feed report due out this Friday, after the close. This report will be widely watched and may move the markets dramatically. If you’re a producer worried about protecting these high prices, perhaps a Put Option position, with a short-term bias, would serve that purpose. Call me for suggestions if you need some input.
June Live Cattle (Weekly)
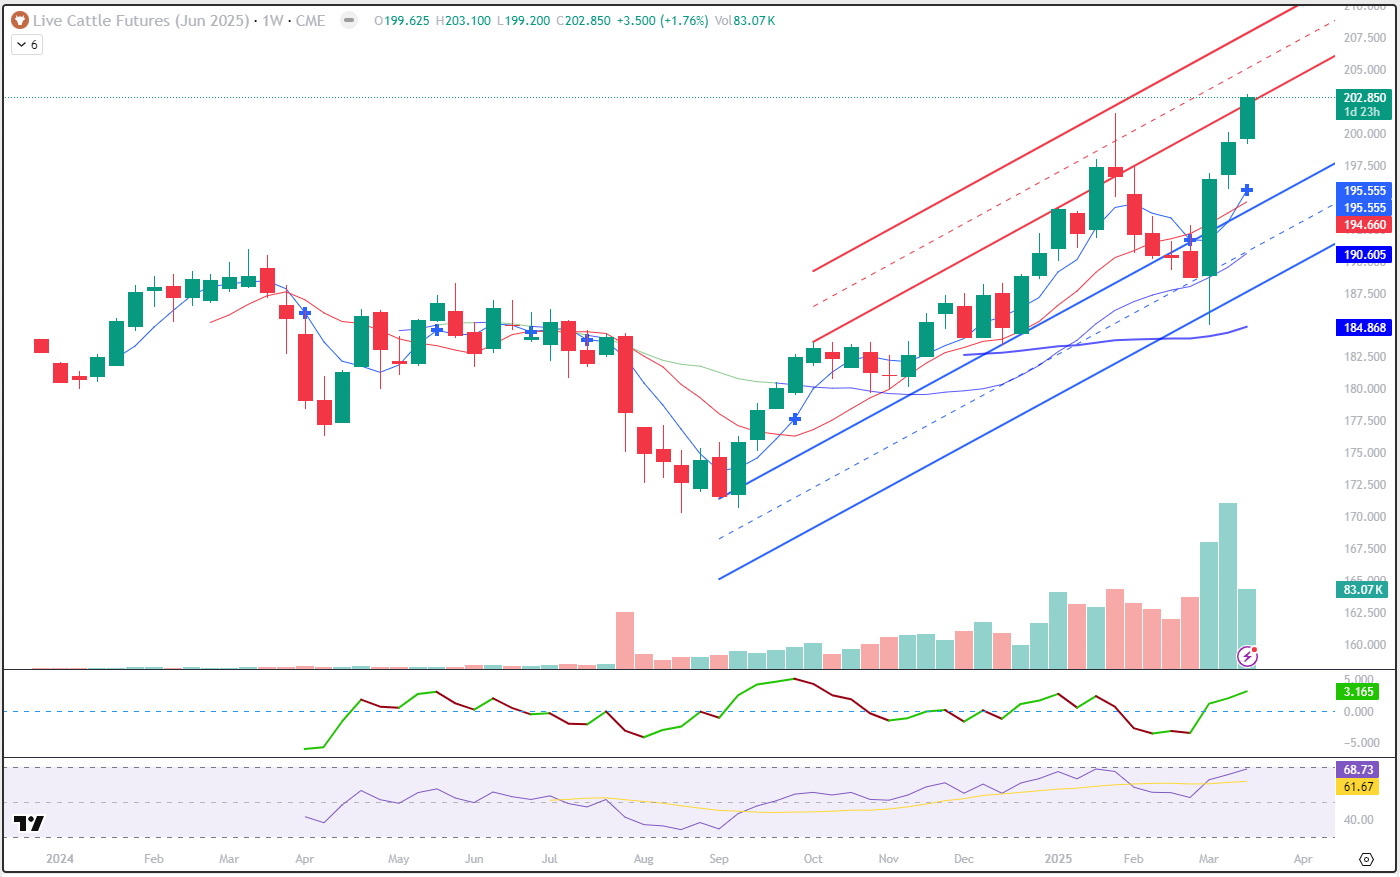
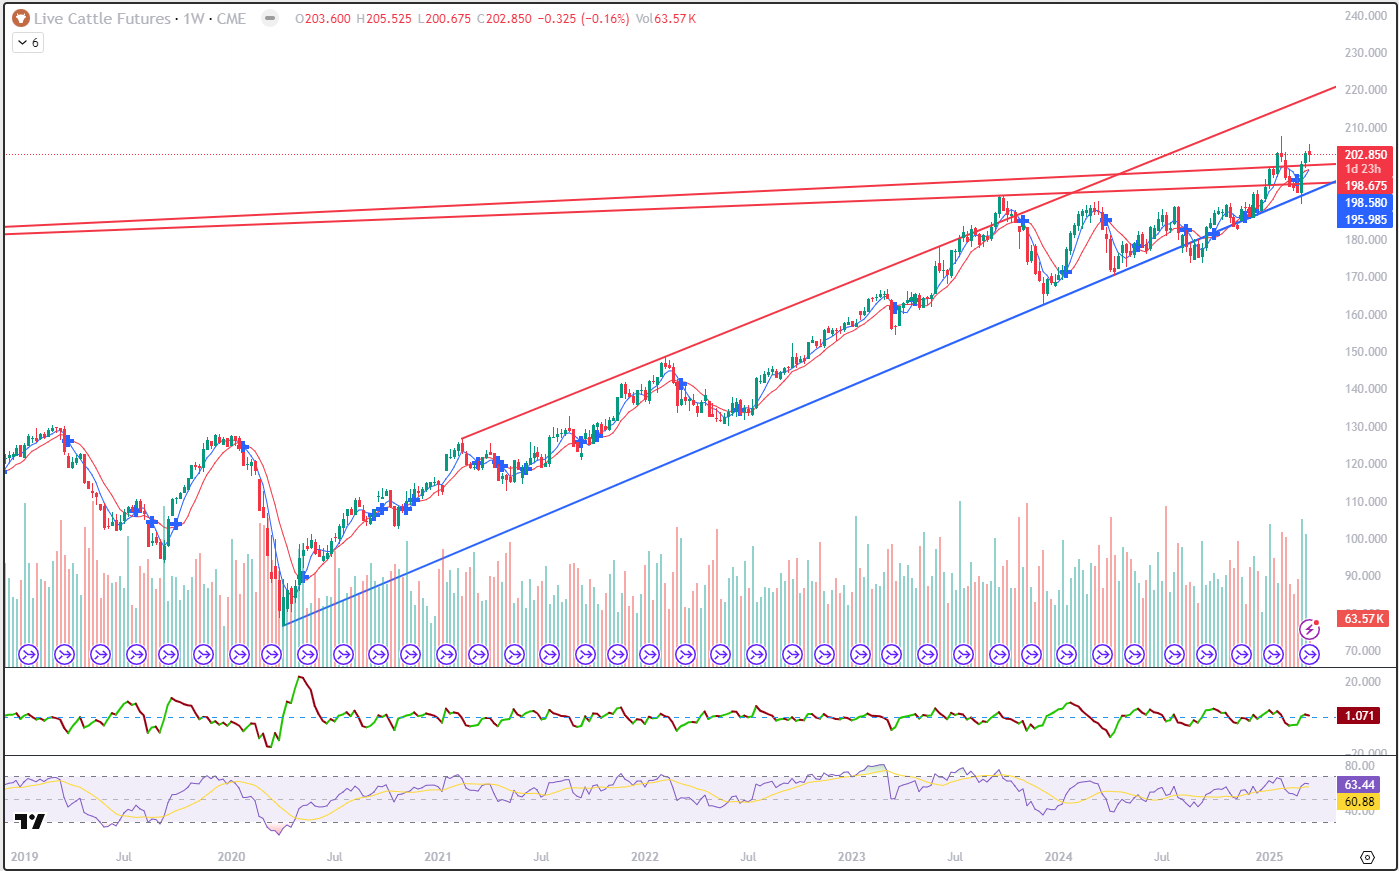
The Weekly chart of June Fat Cattle appears bullish to my eye. New contract highs and 3 strong bullish weeks in a row are both supportive, I think. You might notice that blue cross under this week’s bar. That indicates a bullish crossover of the 5- and 10-week moving averages. (blue, red, 195.555 and 194.600, respectively) That crossover is usually a sign of a trend shift. In this case, I think it’s more a signal of trend resumption, as this market has been going up since September. In fact, the continuous Live Cattle chart that I see (pictured below) seems to show the trend that began in 2020 has not really been challenged. That chart suggests resistance or an eventual target up near 220.000. What do you see?
Live Cattle (continuous front month, weekly)
June Live Cattle (Seasonal)
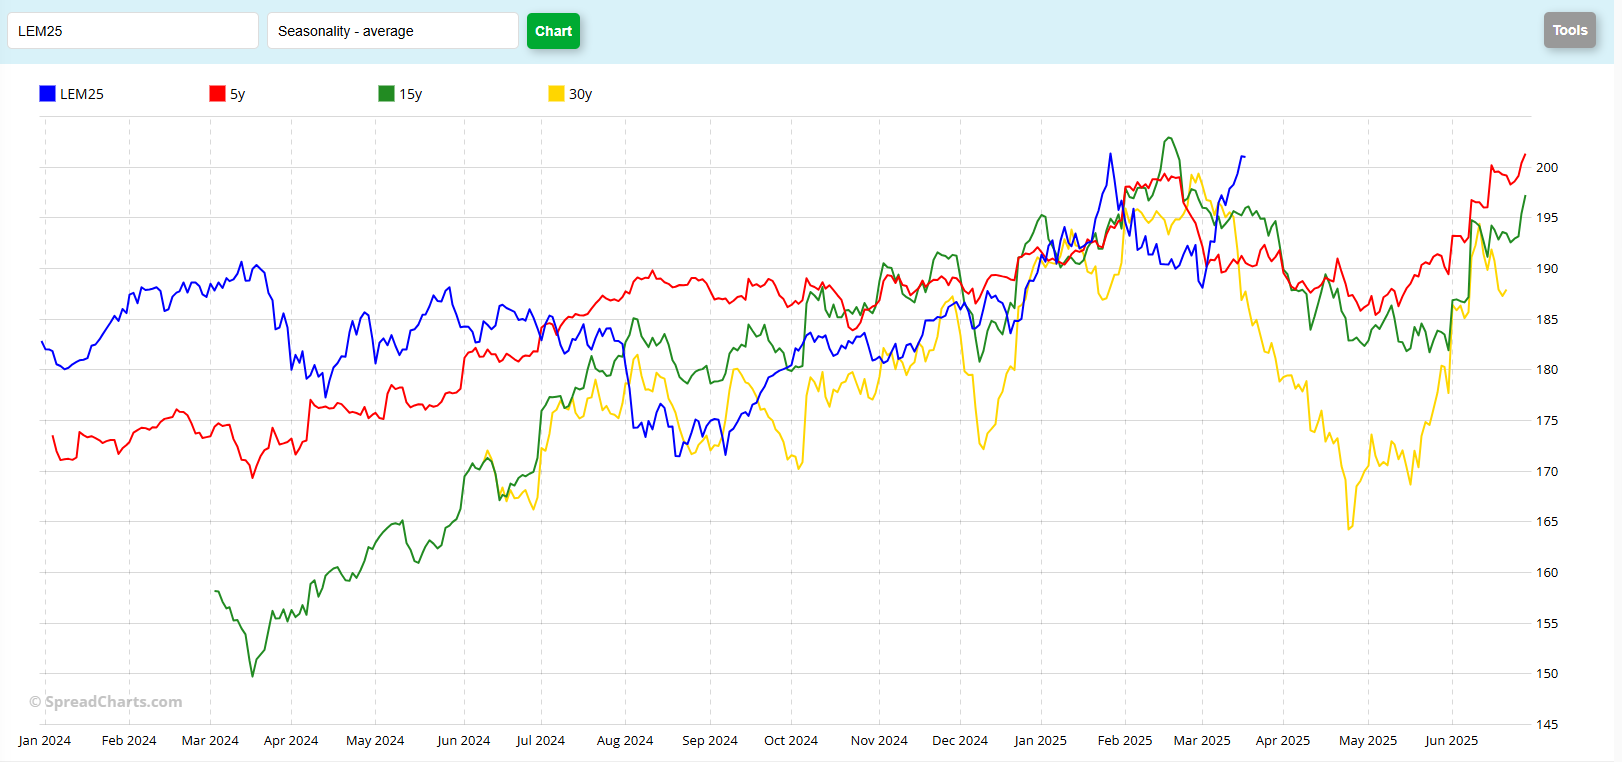
The seasonal chart for June Live Cattle suggests to my eye that the market should be trending lower, if historical data is to be believed. However, this market currently appears to be deviating from the seasonal tendencies. And this chart doesn’t even show today’s trade and price activity. You’ll notice that the 5- (red) 15- (green) and 30-year (yellow) patterns are all indicating a weak historical trend. The biggest takeaway that I get from this chart is that the seasonals, currently, don’t really matter. It’s possible that the market will get “back in line” and sell off as we move forward, but current conditions don’t indicate that. In fact, when I break into the individual years, 2023 and 2024 both trended higher until expiration. If you’d like to see that chart, reach out and let me know, I’ll send it to you directly.
Jefferson Fosse Walsh Trading
Direct 312 957 8248 Toll Free 800 556 9411
jfosse@walshtrading.com www.walshtrading.com
Walsh Trading, Inc. is registered as a Guaranteed Introducing Broker with the Commodity Futures Trading Commission and an NFA Member.
Futures and options trading involves substantial risk and is not suitable for all investors. Therefore, individuals should carefully consider their financial condition in deciding whether to trade. Option traders should be aware that the exercise of a long option will result in a futures position. The valuation of futures and options may fluctuate, and as a result, clients may lose more than their original investment. The information contained on this site is the opinion of the writer or was obtained from sources cited within the commentary. The impact on market prices due to seasonal or market cycles and current news events may already be reflected in market prices. PAST PERFORMANCE IS NOT NECESSARILY INDICATIVE OF FUTURE RESULTS. All information, communications, publications, and reports, including this specific material, used and distributed by Walsh Trading, Inc. (“WTI”) shall be construed as a solicitation for entering into a derivatives transaction. WTI does not distribute research reports, employ research analysts, or maintain a research department as defined in CFTC Regulation 1.71.