
The information and opinions expressed below are based on my analysis of price behavior and chart activity
December Corn (Daily)
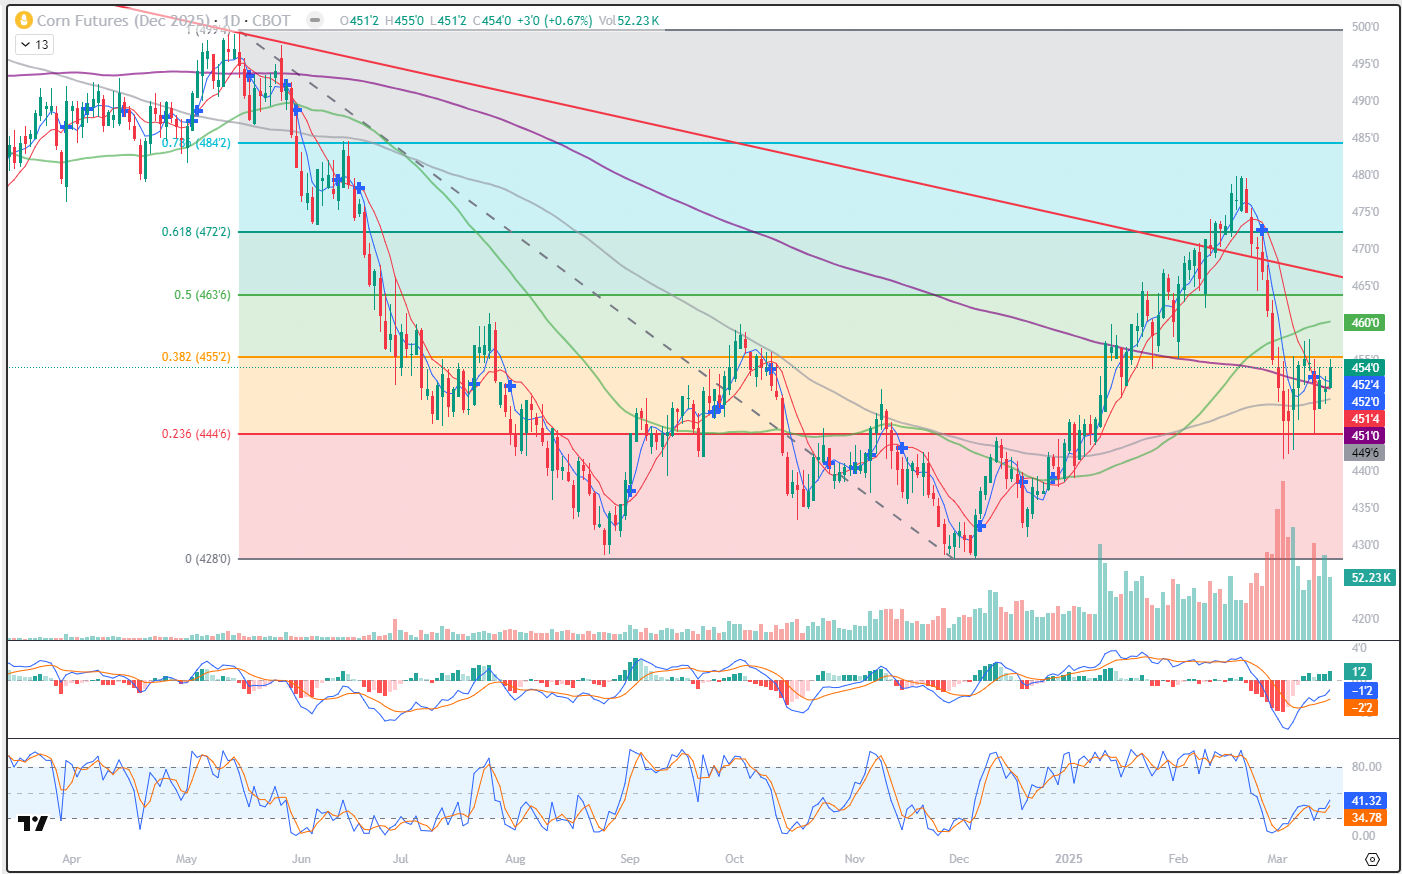
December Corn settled at 4.54 on Monday, up 3 cents from Friday’s close. During the month of March, this market has seemed to find support right near 4.48-4.50. I think that is somewhat bullish, as traders had the opportunity last Wednesday to push the market back down, but buying interest came into the market. You might notice the large “wicks” under the price candles this month, also usually an indication of buying support, as bearish traders were unable to push the market lower. I also this that it has been a friendly technical development that we’ve not yet made new lows for the move. As I hinted at above, I’m of the opinion that if the bears wanted to lean into this market and push it down, they would have done that already. Today’s close is also above long-term support, as shown by the 200-day moving average (purple) at 4.51. We also saw price stay above both the 5- and 10-day moving averages, effectively negating last week’s bearish crossover at 4.52 ½. Stochastics and MACD (subgraphs) are also point toward price strength, or at least, a lack of weakness. Those averages are at 4.52 and 4.51 ½, respectively. The 50-day average (green) gives an upside resistance target at 4.60 today, while the 100-dau is offering potential support near 4.49 ¾. While I’m not ragingly bullish due to the South American crops, uncertainty over foreign tariffs (those go into effect April 2nd, allegedly) and rumblings of large potential acreage number here in the US before the Prospective Plantings, March 31st @ 11AM, I don’t think that the selloff at the end of May was entirely warranted and may have gone a bit too far, too fast. And since the market has been unable to head toward the December lows and may have just made an aggressive retracement, the long side of the market catches my eye. Aggressive and well-margined traders may do well to consider long futures positions, with a risk/reverse just under last week’s low of 4.45.
December Corn (Weekly)
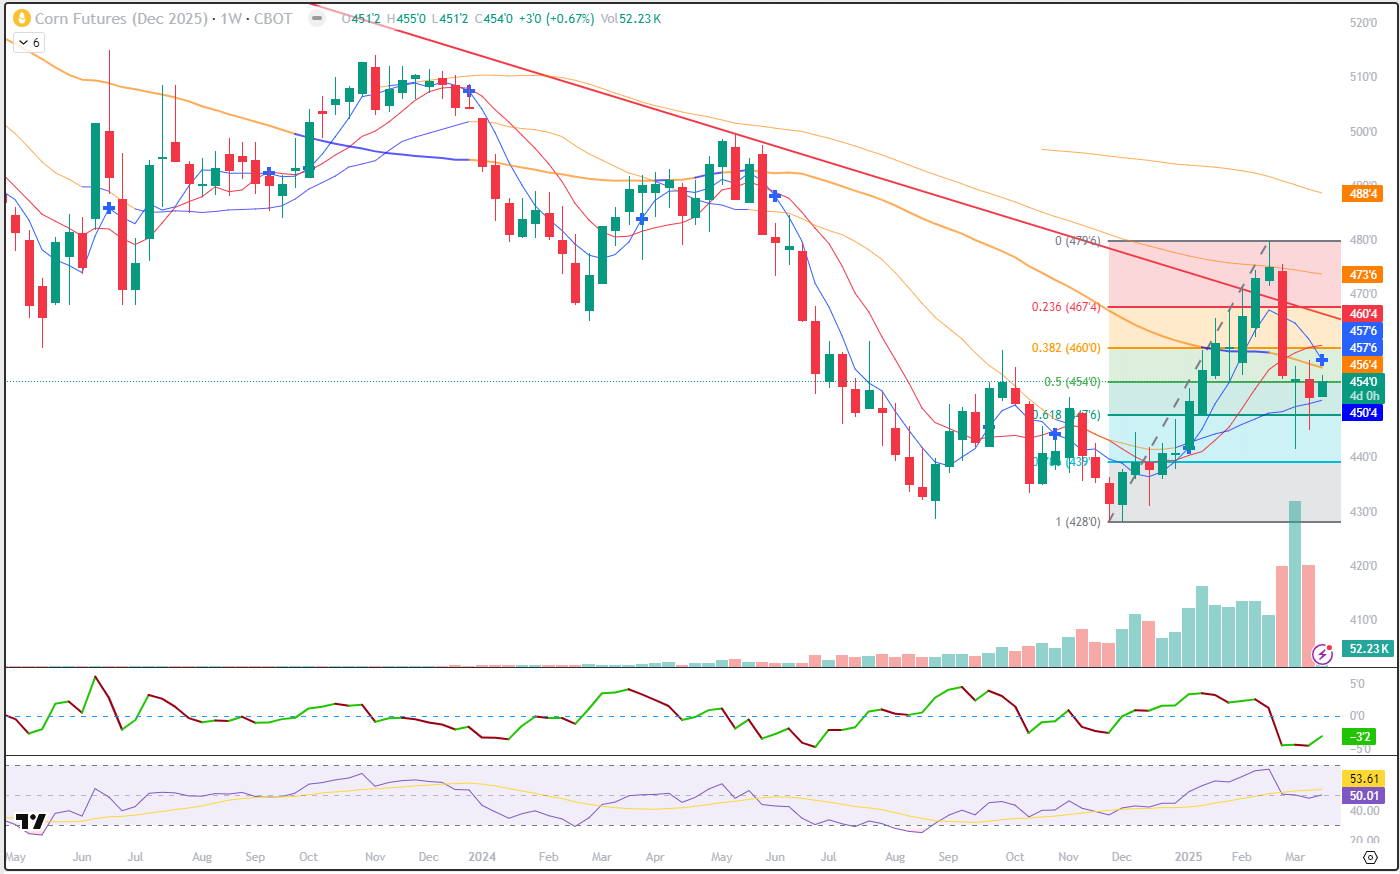
The weekly December Corn charts still indicates to me that the market is in a downtrend. You may see that blue cross just above this week’s bar. That denotes the 5- and 10-week moving averages crossing into bearish territory. Perhaps this might be a situation like Feeder Cattle (see my note from last week) where the weekly signals reverse in quick succession. The red horizontal trendline (drawn off of the April 2022 and May 2024 highs seems to still be offering significant resistance. The 2 weekly closes above it in Feb were very positive, but “tariff selling” emerged 4 weeks (bars) ago, resuming that decidedly bearish trend. But as I look closer, perhaps not all is doom and gloom. I’ve added a different Fibonacci retracement to this chart, extending from the lows in Nov/Dec to the highs mid-February. On a closing basis, the 62% retracement at 4.47 ¾ has held as support, after being tested 2 consecutive weeks. Last week’s trade did see higher highs and higher lows and the followed a week where prices began and ended at (nearlY0 the same price. That week’s range was from 4.56 ¾ to 4.41 ½. That is a fairly wide range, but I would use those high/low levels as a potential trade trigger. A buy stop above that high (or even just above last week’s high of 4.57 ¾) would serve as a long entry, with a sell stop below that low would serve as a short entry. The weekly chart suggest resistance at 4.56 ½ (50 week, orange) with the 5- and 10-week averages just above that, near 4.57 ¾ and 4.60 ½, (blue and red, respectively) Producers may do well to have 25-30% of their intended production protected at this point. I would look at December Put options or Put Spreads (450/400 puts closed at 21 ¾ cents today, before commissions and fees) as a way of managing that downside price risk, rather than the futures, at this time.
December Corn (Seasonal)
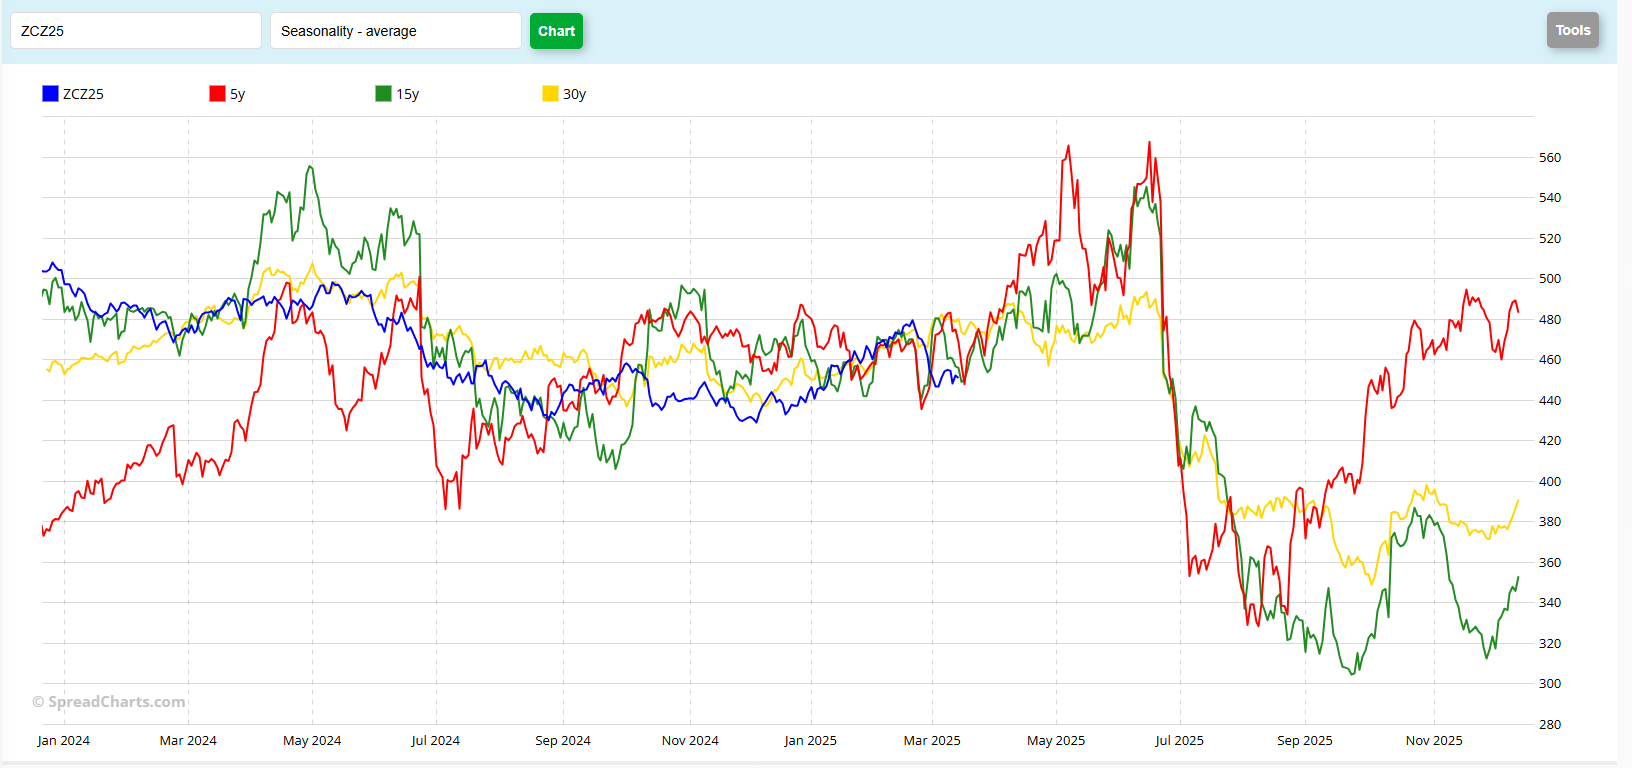
The December Corn seasonal chart seems to indicate an upward trend, as I look forward over the next 3 months or so. As this is “new crop” Corn, my experience tells me that it’s usually due to planting delays and weather. We still have a little time before planting ramps up in 2025, so we’ll have to wait and see if the weather is cooperative this spring or not. The 5-year pattern (red) suggests a rally of over $1.00 (4.48 avg low in Mid-March, to a 5.65 avg high near the beginning of May) over the next several weeks, ending roughly the 1st week in May. The 15-year pattern (green) suggests nearly $1.00 (4.49 avg low in Mid-March to 5.45 in Mid-June) over a little longer period, extending until roughly Father’s day. Following that point time, The 30-year pattern (yellow) suggest a choppy (up, down, up) period until Father’s Day, with only a 20 cent move (4.72 average in mid-March to 4.93 in mid-June) The past 5 years have been unusual times, in my opinion, but we may be getting some, or most of that, behind us now. It will be interesting to see, as time moves forward, if trade conflicts (perceived as bearish) or US weather forecasts (perceived as bullish) dominates the trade.
Jefferson Fosse Walsh Trading
Direct 312 957 8248 Toll Free 800 556 9411
jfosse@walshtrading.com www.walshtrading.com
Walsh Trading, Inc. is registered as a Guaranteed Introducing Broker with the Commodity Futures Trading Commission and an NFA Member.
Futures and options trading involves substantial risk and is not suitable for all investors. Therefore, individuals should carefully consider their financial condition in deciding whether to trade. Option traders should be aware that the exercise of a long option will result in a futures position. The valuation of futures and options may fluctuate, and as a result, clients may lose more than their original investment. The information contained on this site is the opinion of the writer or was obtained from sources cited within the commentary. The impact on market prices due to seasonal or market cycles and current news events may already be reflected in market prices. PAST PERFORMANCE IS NOT NECESSARILY INDICATIVE OF FUTURE RESULTS. All information, communications, publications, and reports, including this specific material, used and distributed by Walsh Trading, Inc. (“WTI”) shall be construed as a solicitation for entering into a derivatives transaction. WTI does not distribute research reports, employ research analysts, or maintain a research department as defined in CFTC Regulation 1.71.