
The information and opinions expressed below are based on my analysis of price behavior and chart activity
May Feeder Cattle (Daily)
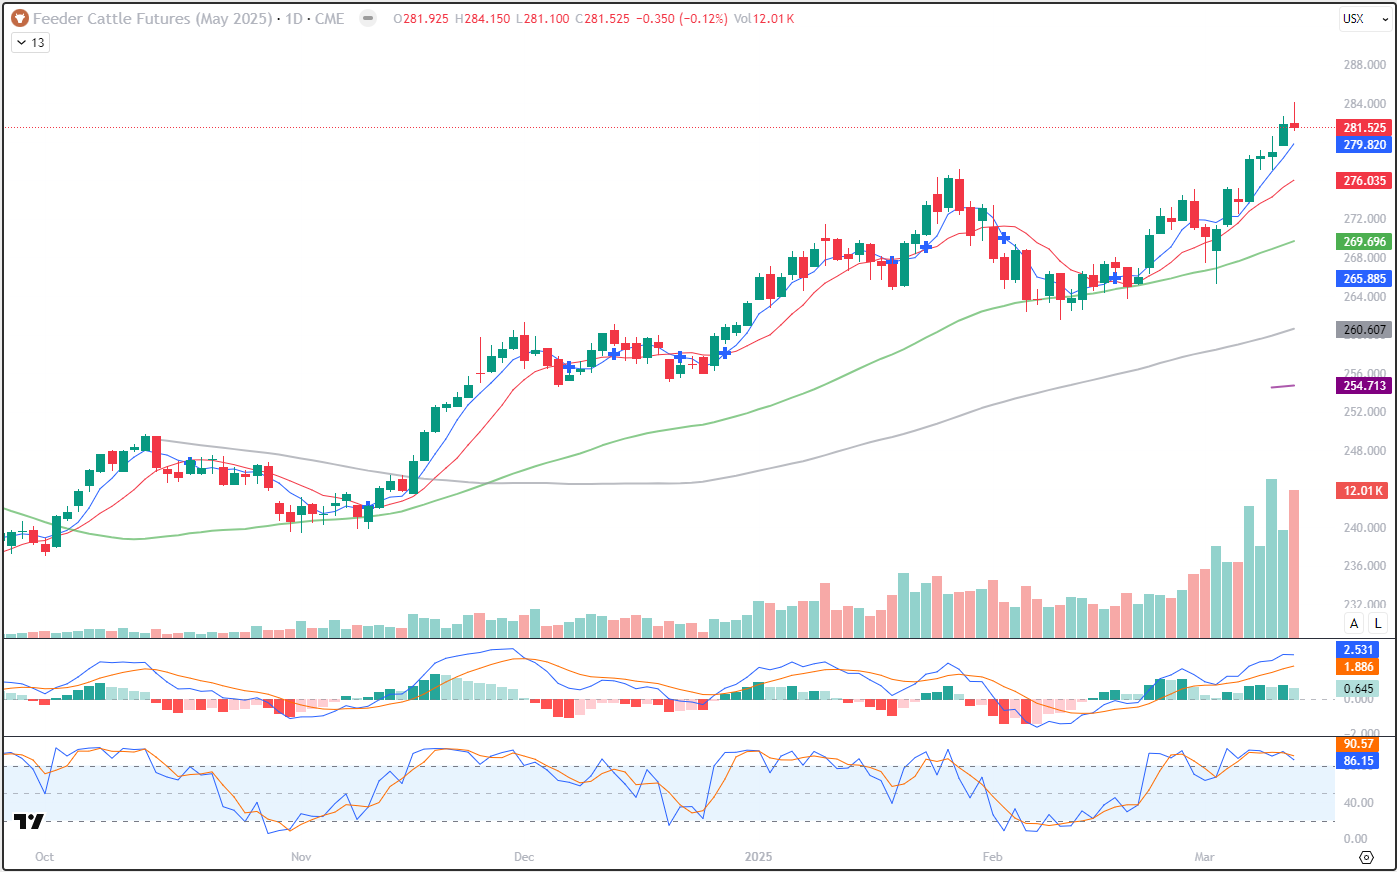
May Feeders closed at 281.525 today, down 0.35 on the day. They did close lower, but have strung together 5 consecutive days of new contract highs. If you look back, the previous streaks like that were just 4 days and both occurred in January. The spike higher today to 284.150 is now a potential resistance level, I think. Nearby support might be found near the 5-day average (blue, 279.820) and further down to the 10-day (red, 276.035) or in-between them at the Jan 29th high of 277.225. Volume was high today, but it did not eclipse the volume spike from Tuesday, which was kind of a neutral-ish day. Stochastics, in the bottom subgraph, did hook slightly lower today, but are still overbought. The MACD just above that also eased a bit today, but neither have turned bearish (or not bullish, anyway) just yet, to my eye. Today’s trade does concern me a bit, however. In my opinion, when markets have a spike move and then finish the day at the other extreme of the range, it can sometimes be a reversal signal. The bars of last Monday and Tuesday support that notion, to my eye. If this market closes lower tomorrow, and especially if it breaks yesterday’s low (279.575) on the close, could be a signal of a top. It might just be temporary, given the trend strength, and the market could just test support levels before resuming higher. The 50-day average (green, 269.696) has held as good support in Oct-Nov and again in February. Tomorrow is Friday and at the end of a week where there’s been a strong move, so far. (5 straight new contract highs!) There’s always the possibility of a profit-taking selloff. The trend is still up. Traders with long positions open may do well to consider a closer risk/reversal sell stop. Producers that are selling cattle soon, may do well to consider Put options to protect the downside if they’re worried about the trend breaking. Read on to the seasonal chart below to see why they might have that concern.
May Feeder Cattle (Weekly)
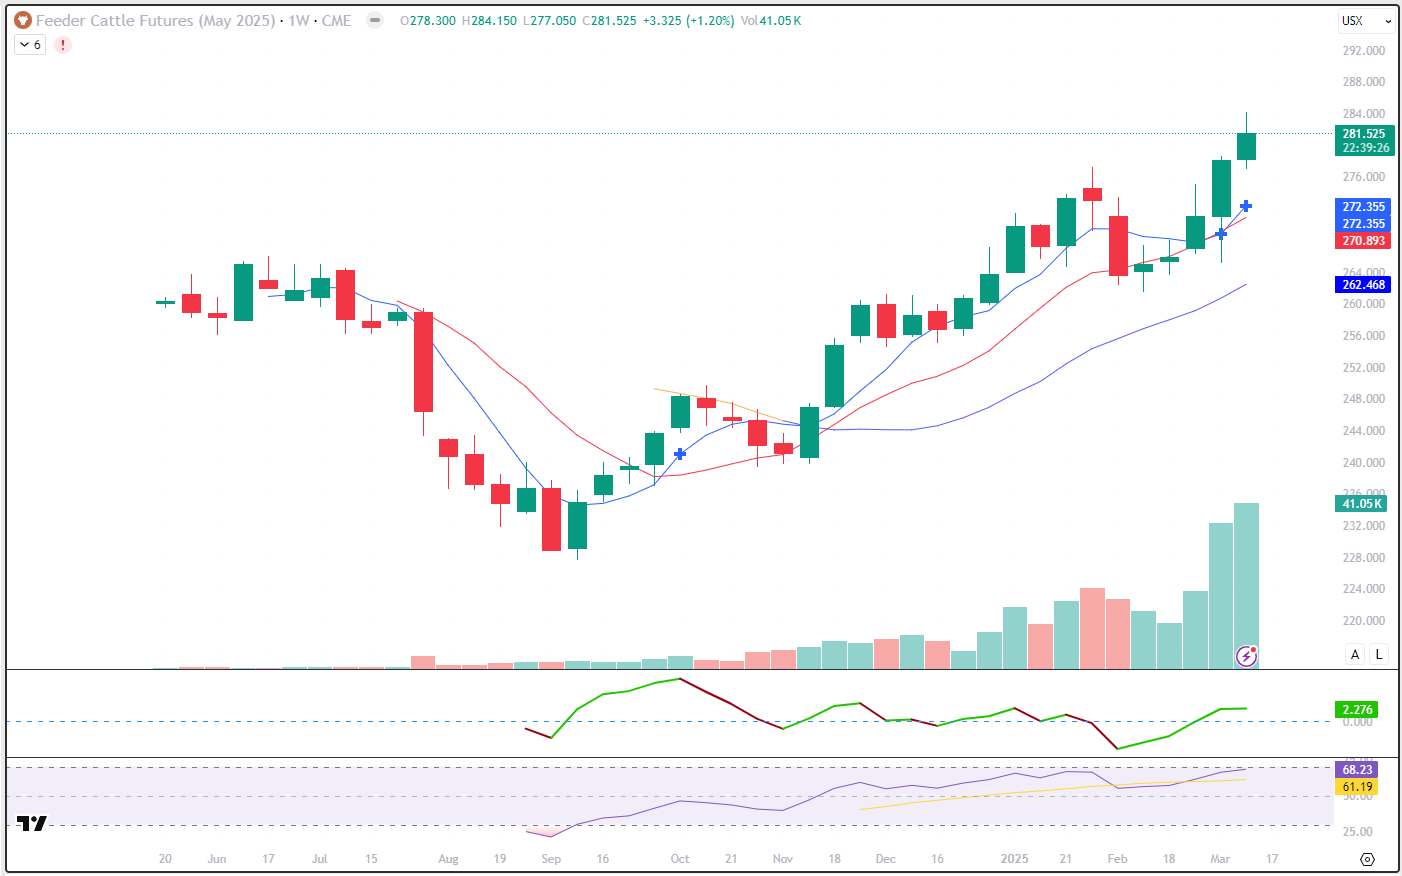
The Feeder Cattle contract doesn’t have a very long life, about a year, so the weekly chart is lacking some of the long-term view that one would normally get from one of these. But there are still some observations to make. First off, it appears that since September the trend has bee up. Certainly, since the second week of November, when prices crossed above the 20-weak moving average. You may notice that it was orange, indicating a downtrend, until prices closed above it. This week, that average is at 262.468 and would be a possible level of weekly support. Second, the 5- and 10-week averages caught the trend change in that first week of October, as denoted by that blue cross on the chart. You might see that they have trigged twice more. Once last week, indicating a bearish shift, but this week’s price activity has resulted in those averages changing right back into bullish territory. While it’s not unusual for trend to change, it is odd that the change occurred in consecutive weeks. Both the Forecast oscillator and the RSI in the bottom subgraphs are pointing toward higher prices, still to come. The RSI is getting a little high, in my opinion, and bears watching. Volume has increased, but that is the result of May becoming the “front month” as traders have rolled positions. The 5-week average at 272.355 and the 10-week average at 270.893 are support levels that need to hold if they’re tested, in my opinion. Those are the blue and red averages closest to the market, respectively, Last week’s high of 278.675 may be support, as well.
May Feeder Cattle (Seasonal)
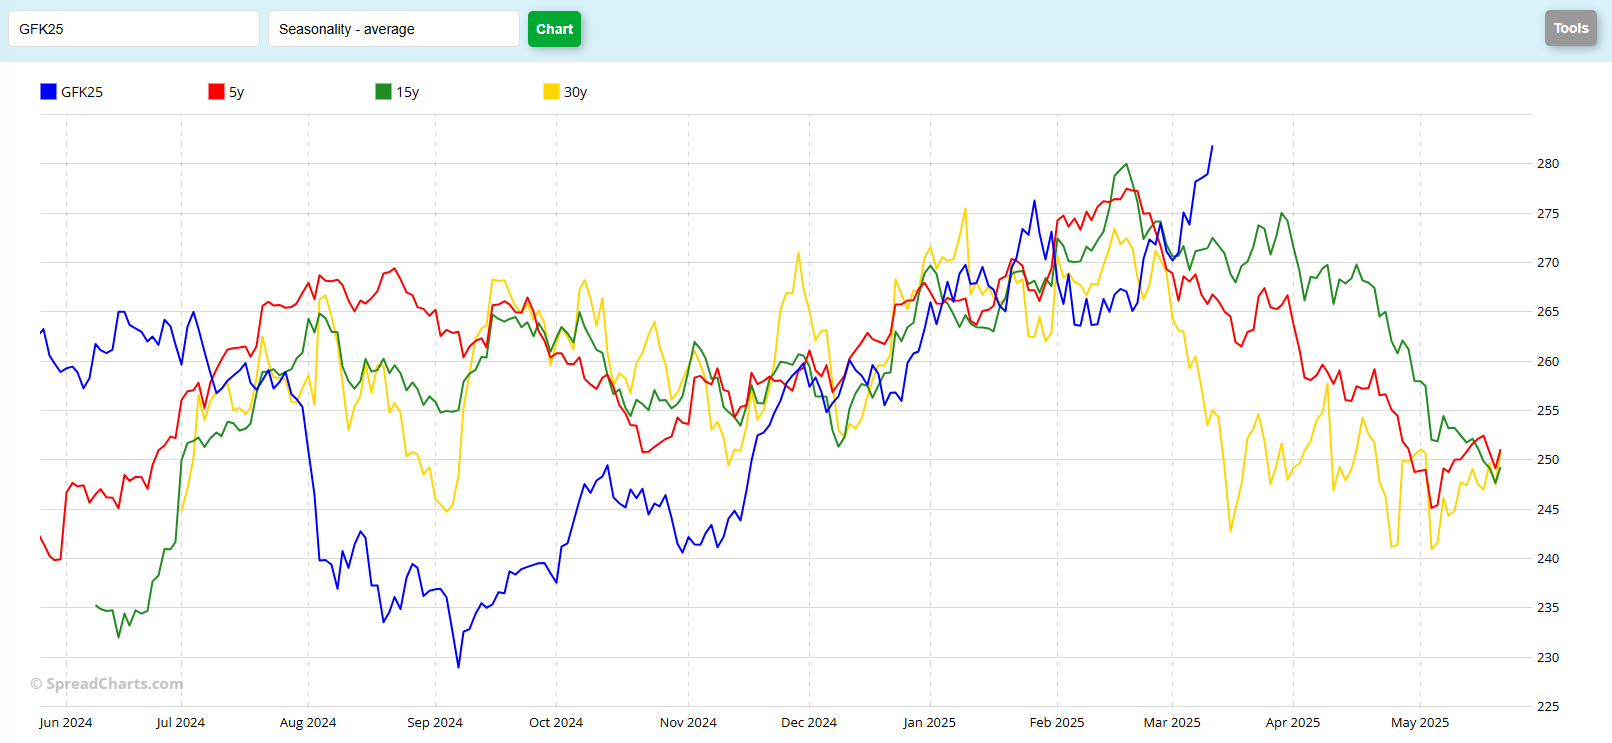
The seasonal chart seems to show a few notable items. First off, perhaps you’ll observe that the May contract has not been following along with historical data. However, while the price levels may not be the same, the price activity does seem to track somewhat, to my eye. For example, the lows last Sept were substantially lower on the chart, but the seasonal low was made then, and prices rallied thereafter. It is not an exact match, but the subsequent price action has fallen in line since Nov-Dec, or so. The price activity since mid-February has certainly bucked the trend, to my eye. The 5-year (red), 15-year (green) and 30-year (yellow) suggest that a top “should” have occurred in mid-Feb. The current contract (blue) made a high in late January, perhaps a few weeks early, and then started to work lower. Now it going against the historical trend and moving higher. The historical data clearly show overall price weakness from now until expiration. I suppose the question is whether the current contract will follow. What do you think?
Jefferson Fosse Walsh Trading
Direct 312 957 8248 Toll Free 800 556 9411
jfosse@walshtrading.com www.walshtrading.com
Walsh Trading, Inc. is registered as a Guaranteed Introducing Broker with the Commodity Futures Trading Commission and an NFA Member.
Futures and options trading involves substantial risk and is not suitable for all investors. Therefore, individuals should carefully consider their financial condition in deciding whether to trade. Option traders should be aware that the exercise of a long option will result in a futures position. The valuation of futures and options may fluctuate, and as a result, clients may lose more than their original investment. The information contained on this site is the opinion of the writer or was obtained from sources cited within the commentary. The impact on market prices due to seasonal or market cycles and current news events may already be reflected in market prices. PAST PERFORMANCE IS NOT NECESSARILY INDICATIVE OF FUTURE RESULTS. All information, communications, publications, and reports, including this specific material, used and distributed by Walsh Trading, Inc. (“WTI”) shall be construed as a solicitation for entering into a derivatives transaction. WTI does not distribute research reports, employ research analysts, or maintain a research department as defined in CFTC Regulation 1.71.